Unmasking Hidden Threats: Using Velociraptor for Process Hollowing Analysis
Introduction
Process hollowing is a technique frequently employed by malware developers to disguise malicious activities by injecting code into legitimate processes [1]. The MITRE ATT&CK framework further elaborates on this technique in detail, particularly under T1055.012 [3]. In this approach, the malware starts a legitimate process in a suspended state, removes its legitimate code, and then replaces it with malicious code [3]. The process is resumed, and it appears to be running normally in the system, making it difficult for traditional security tools to detect the hidden malicious activity.
The key difference between Process Hollowing and Process Injection lies in their execution flow. In Process Hollowing, the malware hijacks a legitimate process and replaces its entire code space [4]. In contrast, Process Injection involves injecting malicious code into an already running process without necessarily replacing the original code [7]. Process Injection can manipulate or extend a legitimate process’s behaviour by introducing new threads or DLLs, while Process Hollowing entirely takes over a process by overwriting its image [7] [5].
In this blog, we will explore how to identify and analyse such malicious techniques using Velociraptor. This tool provides powerful capabilities for hunting and detecting Process Hollowing malware, enabling security analysts to dig deeper into suspicious processes, memory dumps, and hidden behaviours within infected systems.
Velociraptor
Velociraptor is an advanced open-source tool designed for monitoring endpoints, hunting threats, and conducting digital forensics [2]. It provides a flexible and scalable platform for incident response, enabling analysts to query endpoints, gather artefacts, and perform real-time hunts across an environment. What makes Velociraptor unique is its ability to create custom queries using VQL (Velociraptor Query Language), which allows it to adapt to various scenarios.
With Velociraptor, you can collect the same artefact from multiple endpoints simultaneously using a Hunt [2]. Hunts let you monitor offline endpoints by scheduling the collection of artefacts from any endpoints that come back online within a specified timeframe. This feature makes it easy to review the results from all collections, track which endpoints collected the artefact, and ensure that no endpoint collects the same artefact more than once. For more information about Velociraptor, please visit the official documentation.
Lab Configuration
In this lab, there are two operating systems: Windows 10 Pro, functioning as the client, and Ubuntu, serving as the server.
The malware will be executed on the Windows system, while artefacts will be collected using the Ubuntu server where the Velociraptor server has been installed. For detailed instructions on installing and configuring Velociraptor, please refer to the official documentation. This topic will not be covered in this post to optimise time.
Use Case
This lab presents a straightforward use case designed for both beginners and experienced professionals to understand easily.
Rather than hunting blindly through the system, the approach taken here is clear and focused. A known malicious process is running on the victim system; although its name is obvious, the aim is to conduct a blind hunt under the assumption that malware is present on the client system. Velociraptor will be employed to identify and investigate this potential malware, leading to a conclusion about its presence and behaviour. Additionally, the findings will be verified through the graphical user interface (GUI) to enhance understanding and reinforce the results obtained during the hunt.
In Linux Server
To ensure that Velociraptor is functioning correctly, it is assumed that the installation and configuration have been completed as per the guidelines provided on the official documentation. As shown in Fig 2.
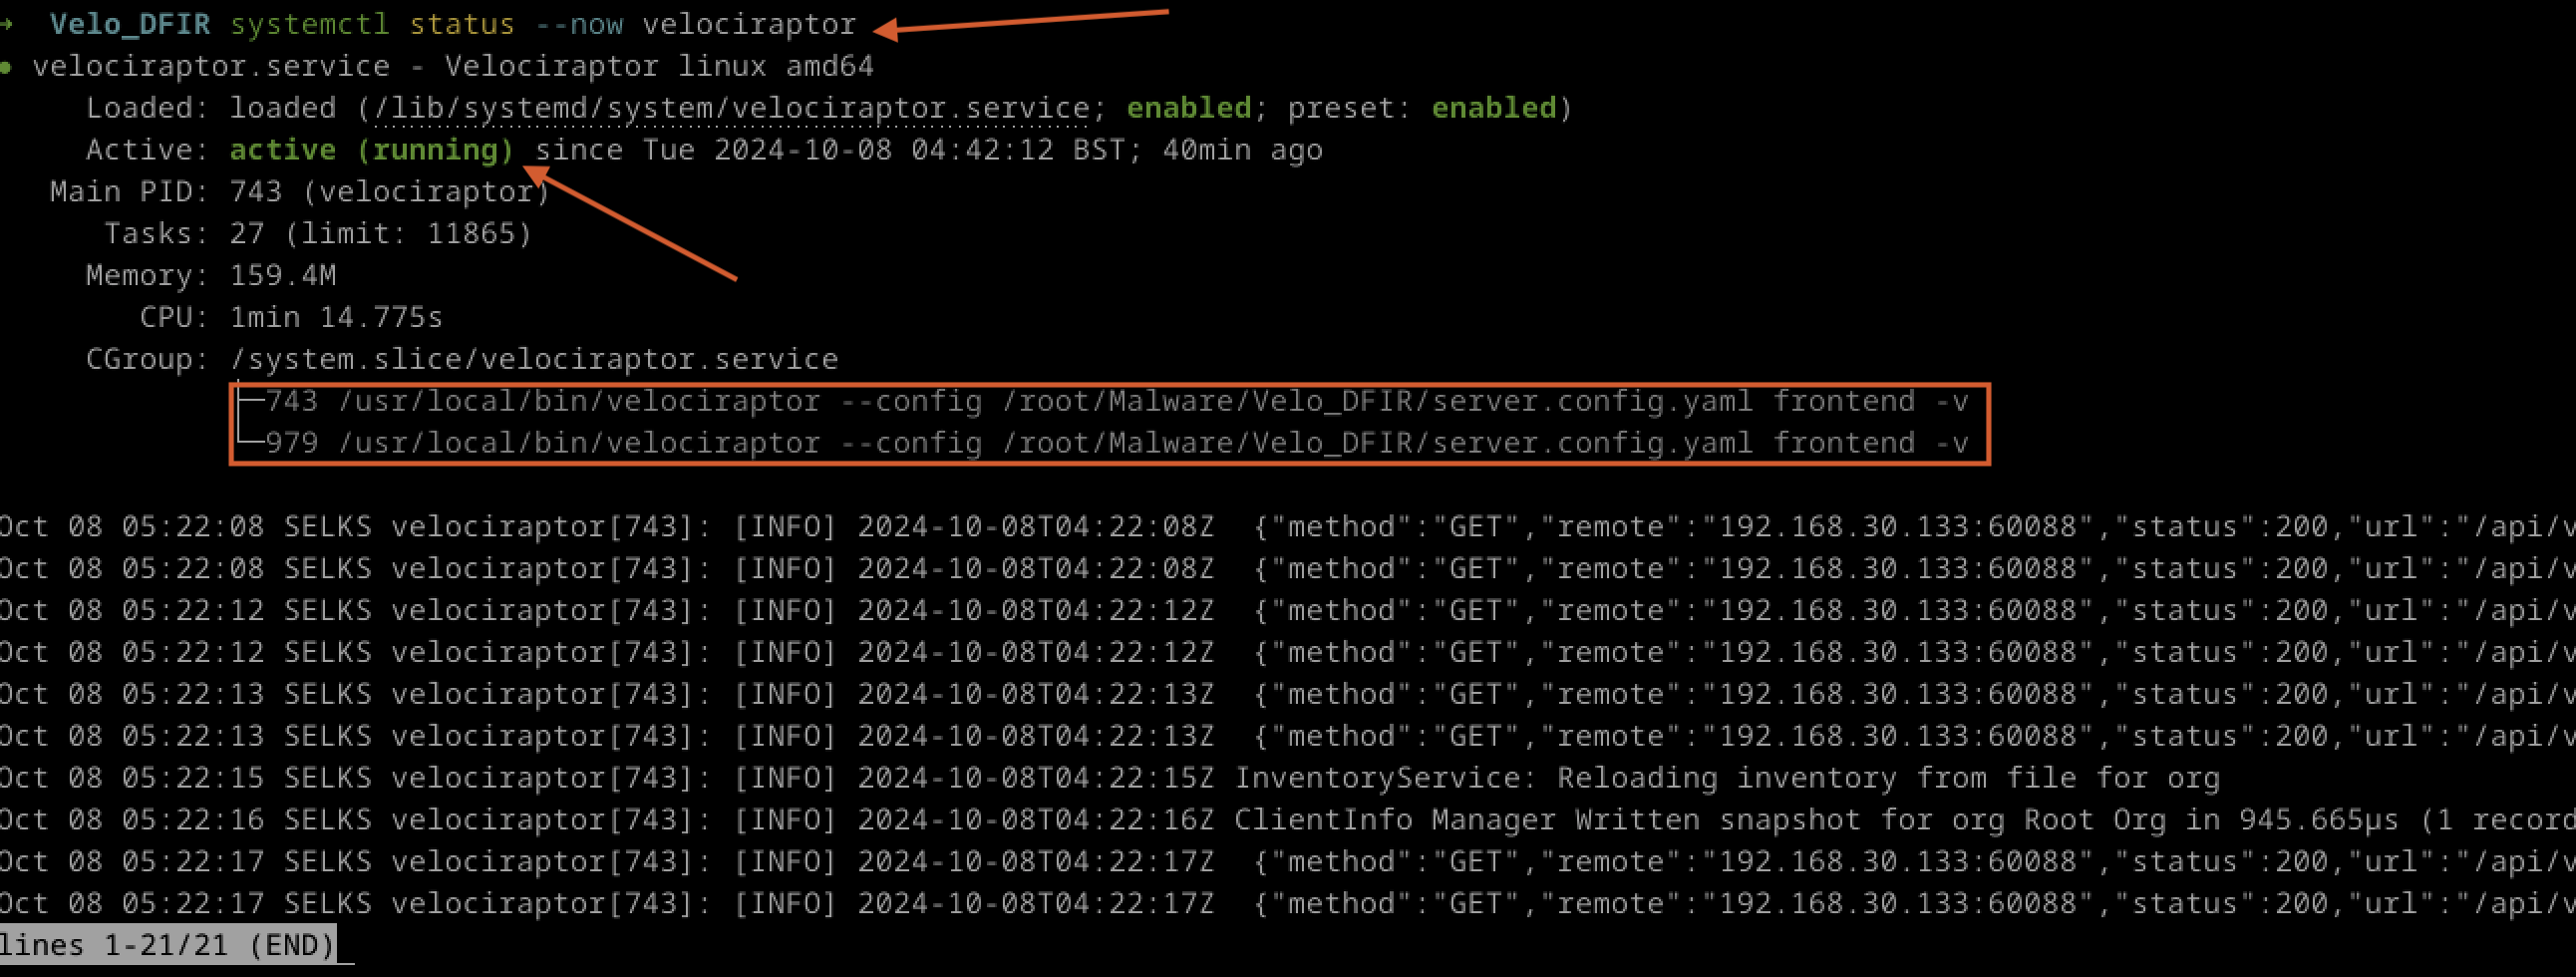
Fig 2: Velocirapto Runing
Velociraptor is active and running on the Linux server. The next step is to add the agent. On the same Linux server, open a web browser and navigate to the Velociraptor URL. The default port is 8889. You can use a local DNS, as shown in the example, or simply your IP address followed by :8889 to access the GUI. Log in using the password you set during the installation process. This section ensures that Velociraptor is operational on the Linux server and guides users on accessing the Velociraptor interface to proceed with further configurations.
In Windows 10 Pro
The next step is to add the clients to the Windows 10 Pro system. To achieve this, a local web server can be hosted on the Linux server to serve the Windows client, as shown in Fig 3.
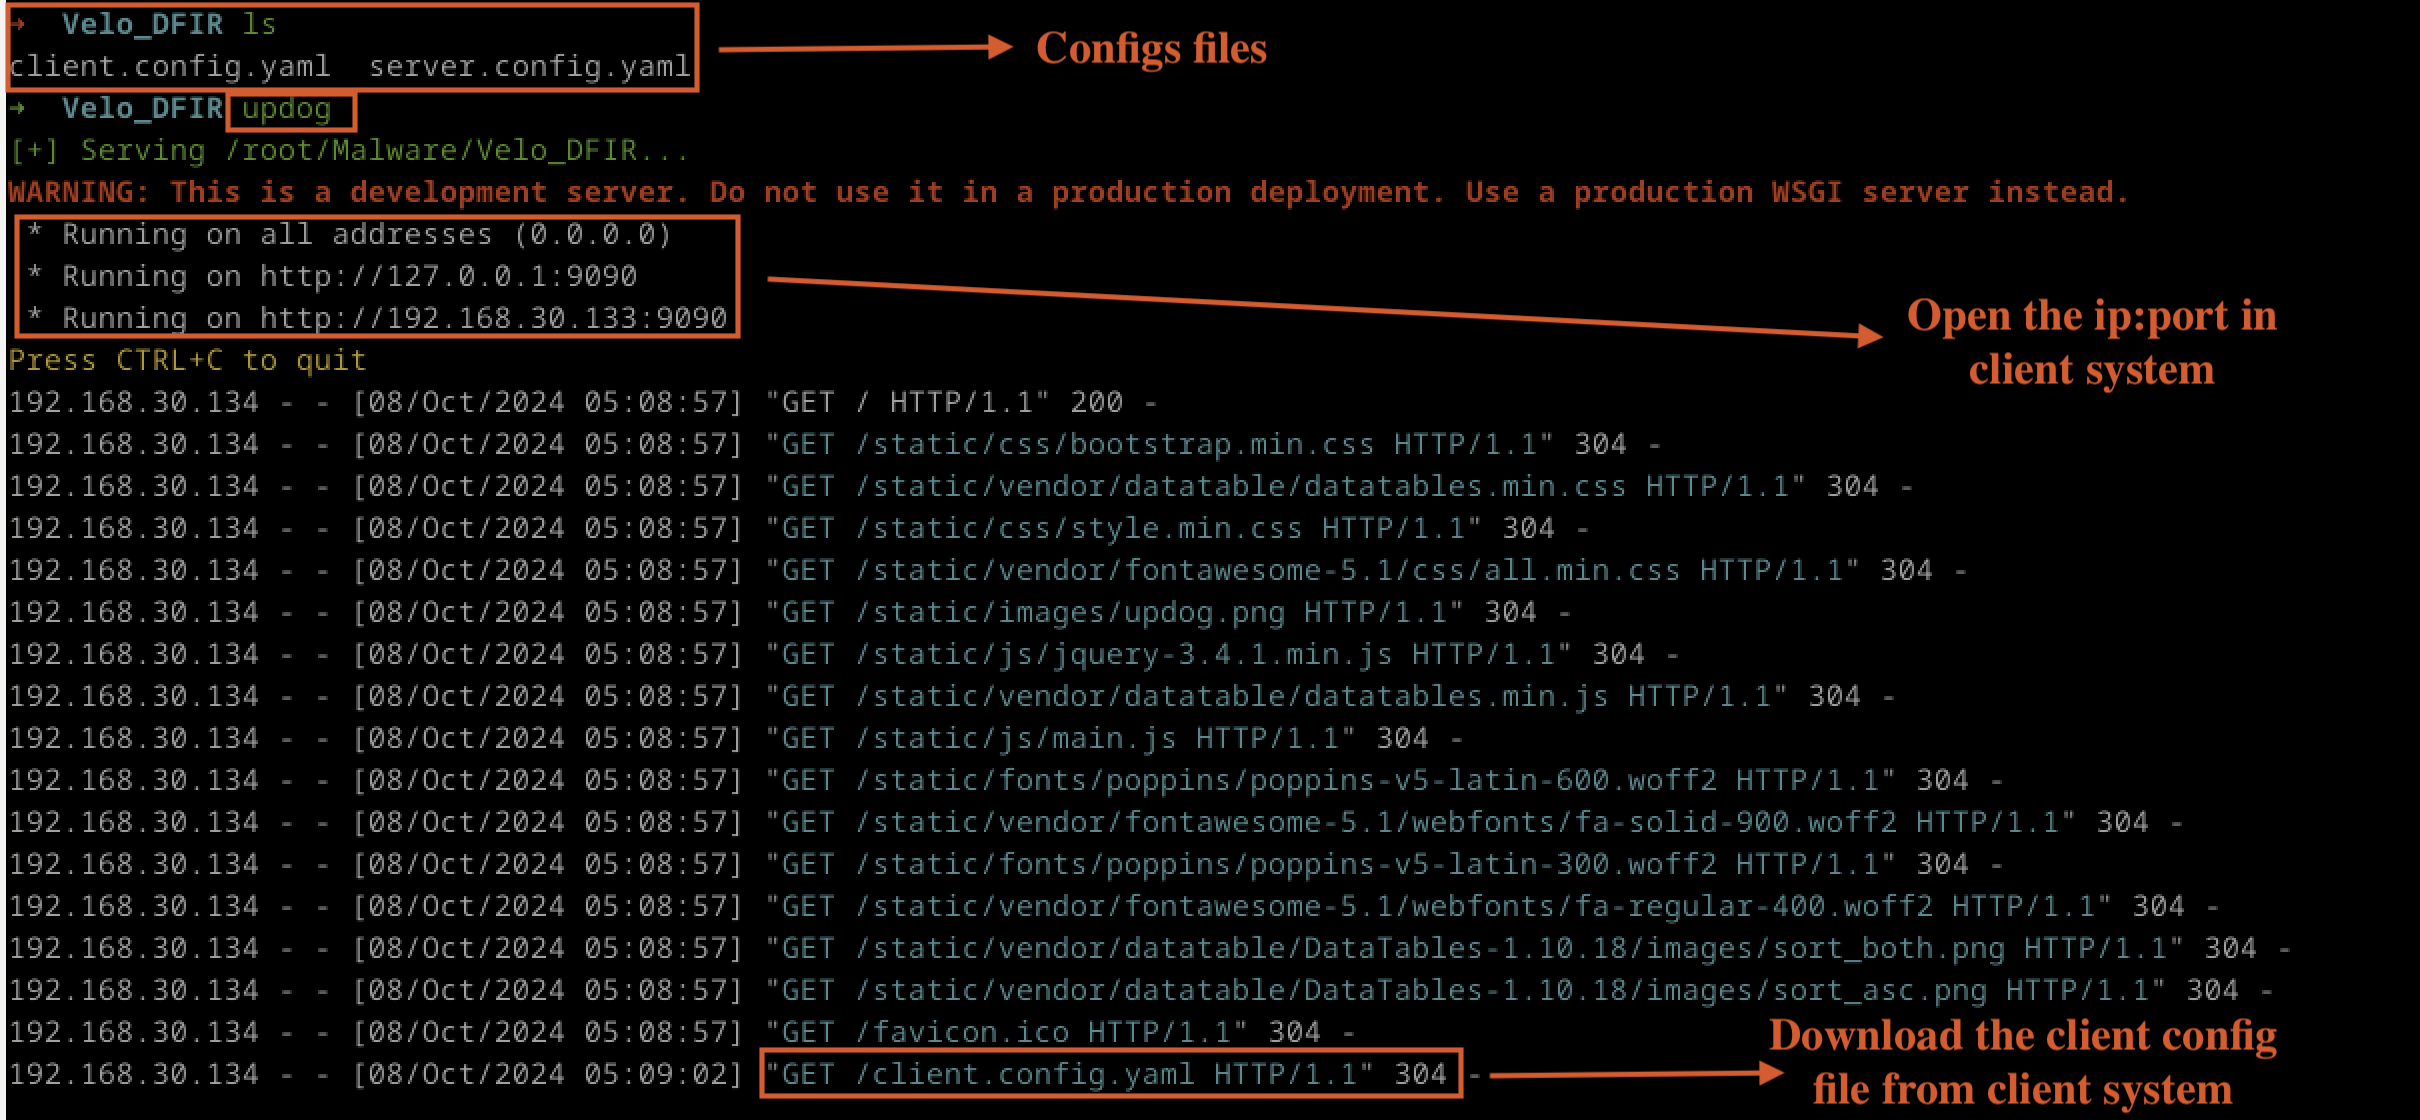
Fig 3: updog up and runing
Users can opt for tools like python http.server, but in this blog, we will use “updog” to serve the configuration file from the Linux server. The Windows client can then download the file.
Please note that both systems are configured under NAT in VMware, meaning they are on the same network and can communicate with each other seamlessly.
After downloading the client configuration file, execute it on the Windows client to ensure it works properly. For more details, refer to Fig 4.
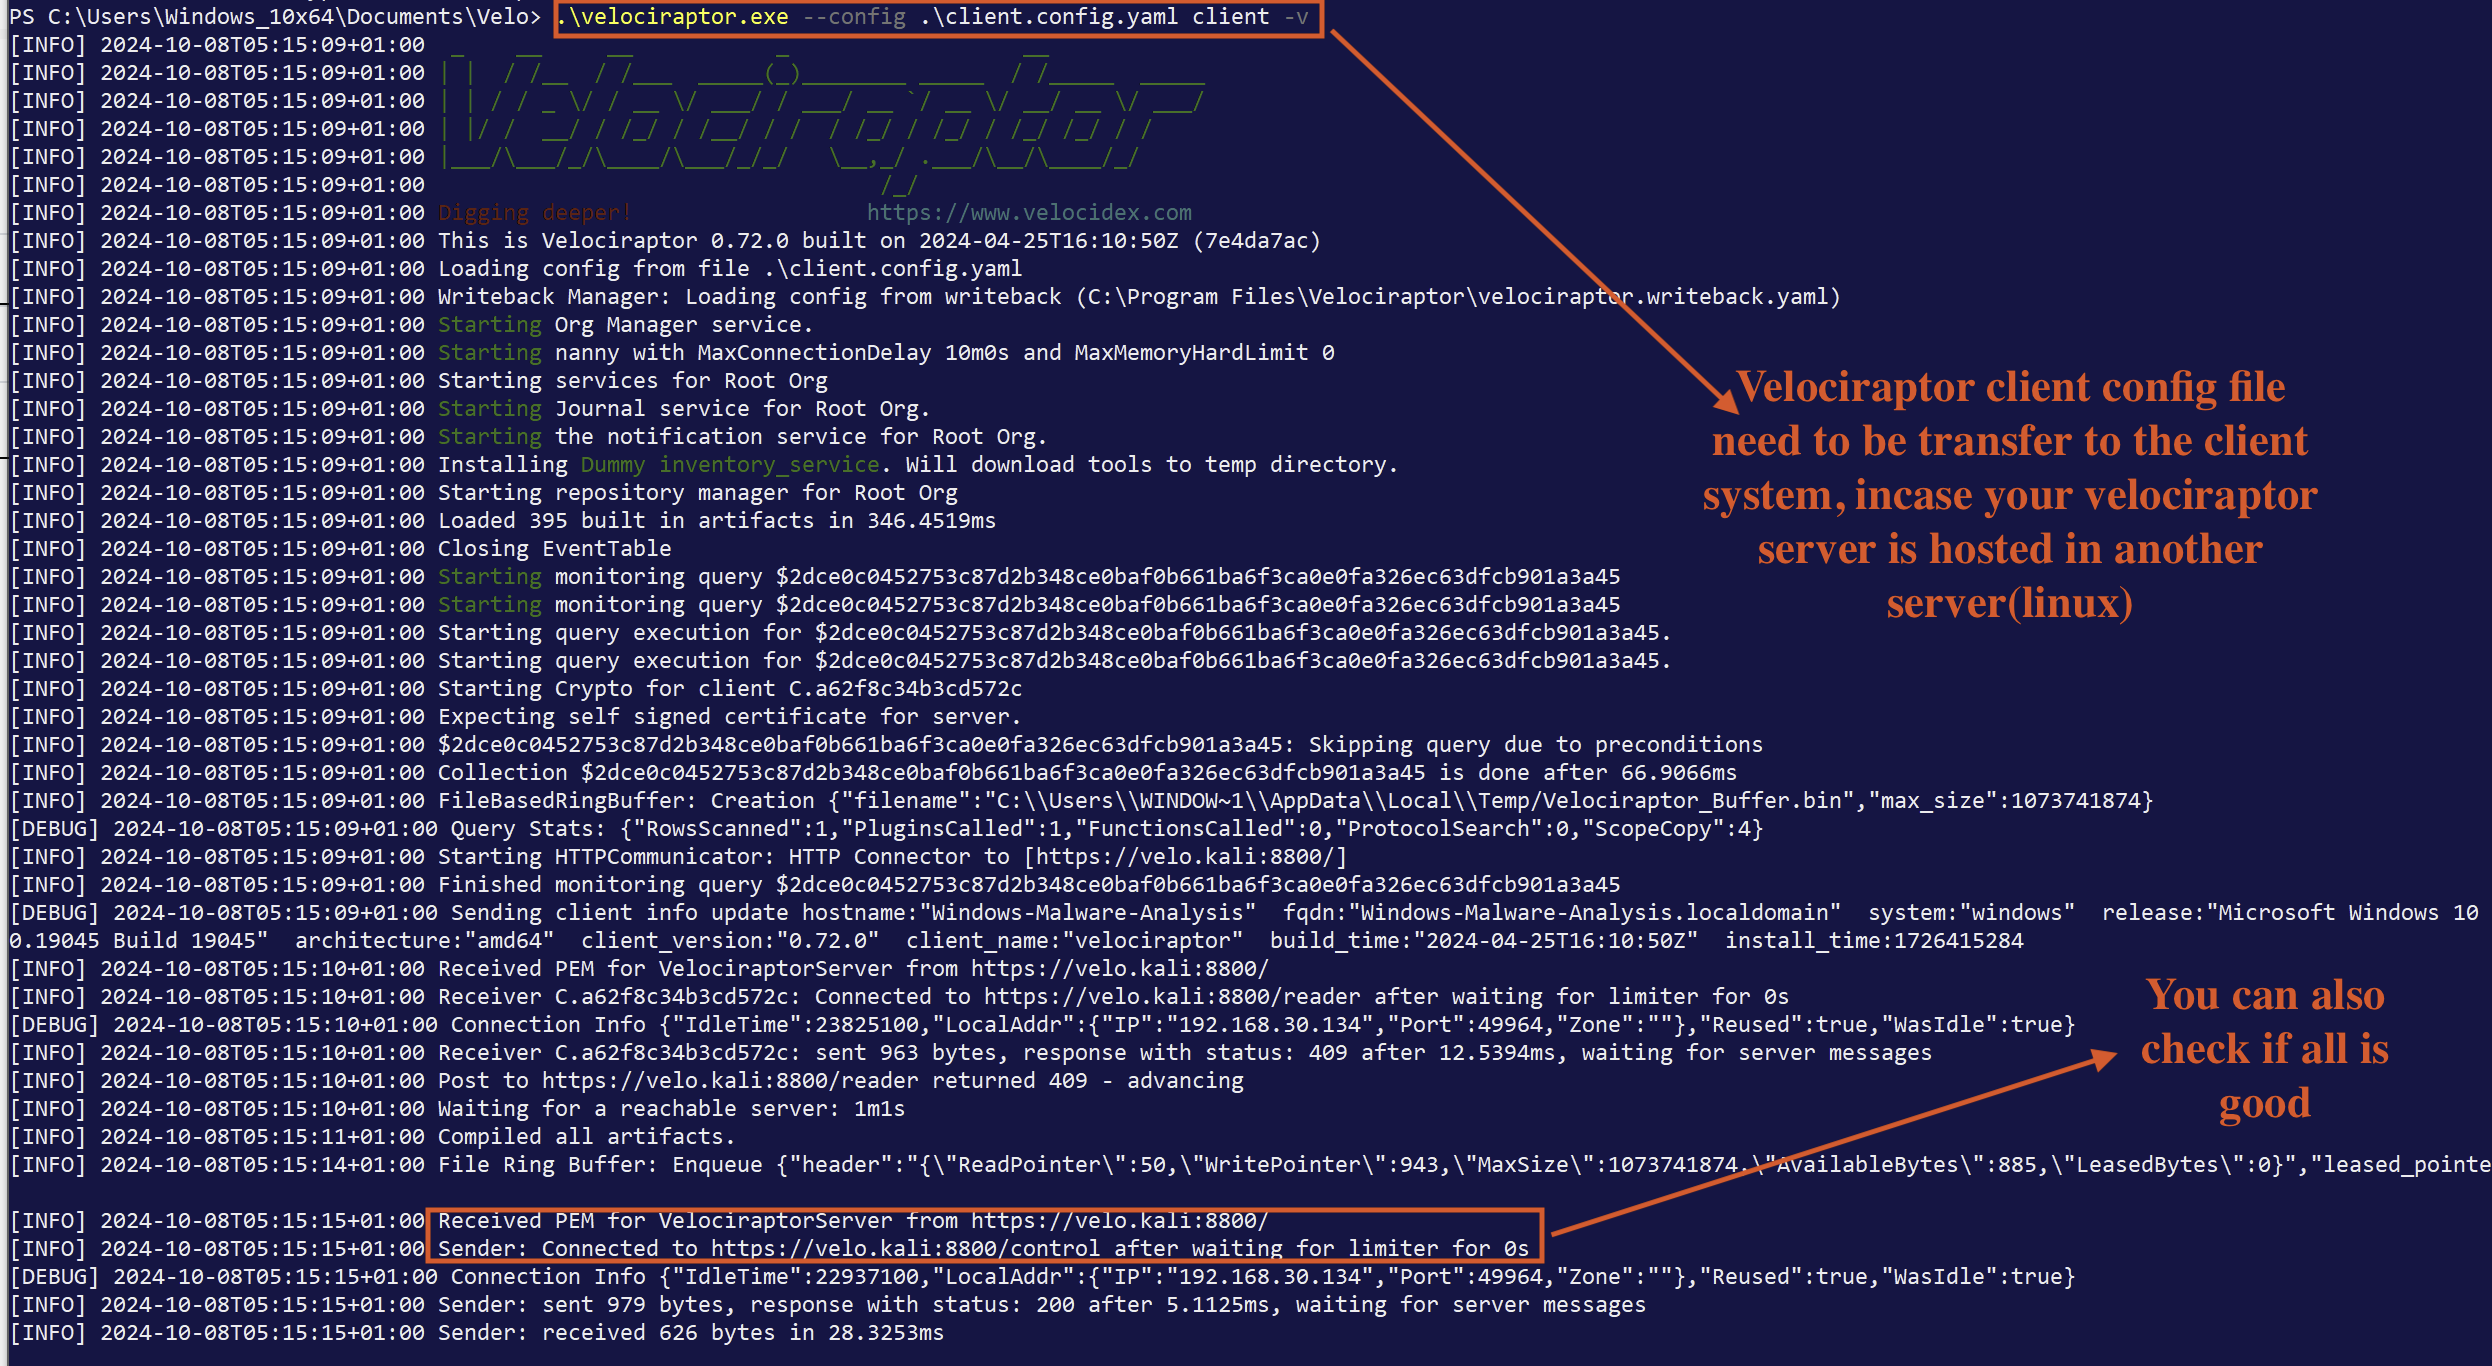
Fig 4: Velociraptor client
If all steps are followed correctly, both the Linux server and the Windows client should now be properly configured, allowing for further actions in Velociraptor.
Before We Begin the Hunt
Before starting the threat hunt and collecting artefacts from the Windows 10 Pro endpoint, we need to ensure that the malware is delivered and executed properly. As previously discussed, use the command pip3 install updog to set up the web server and host the malware from localhost. It doesn’t matter whether you’re using Kali Linux, Kali Purple, or Ubuntu, as the goal is to deliver the malware to the Windows environment, as shown in Fig 5.
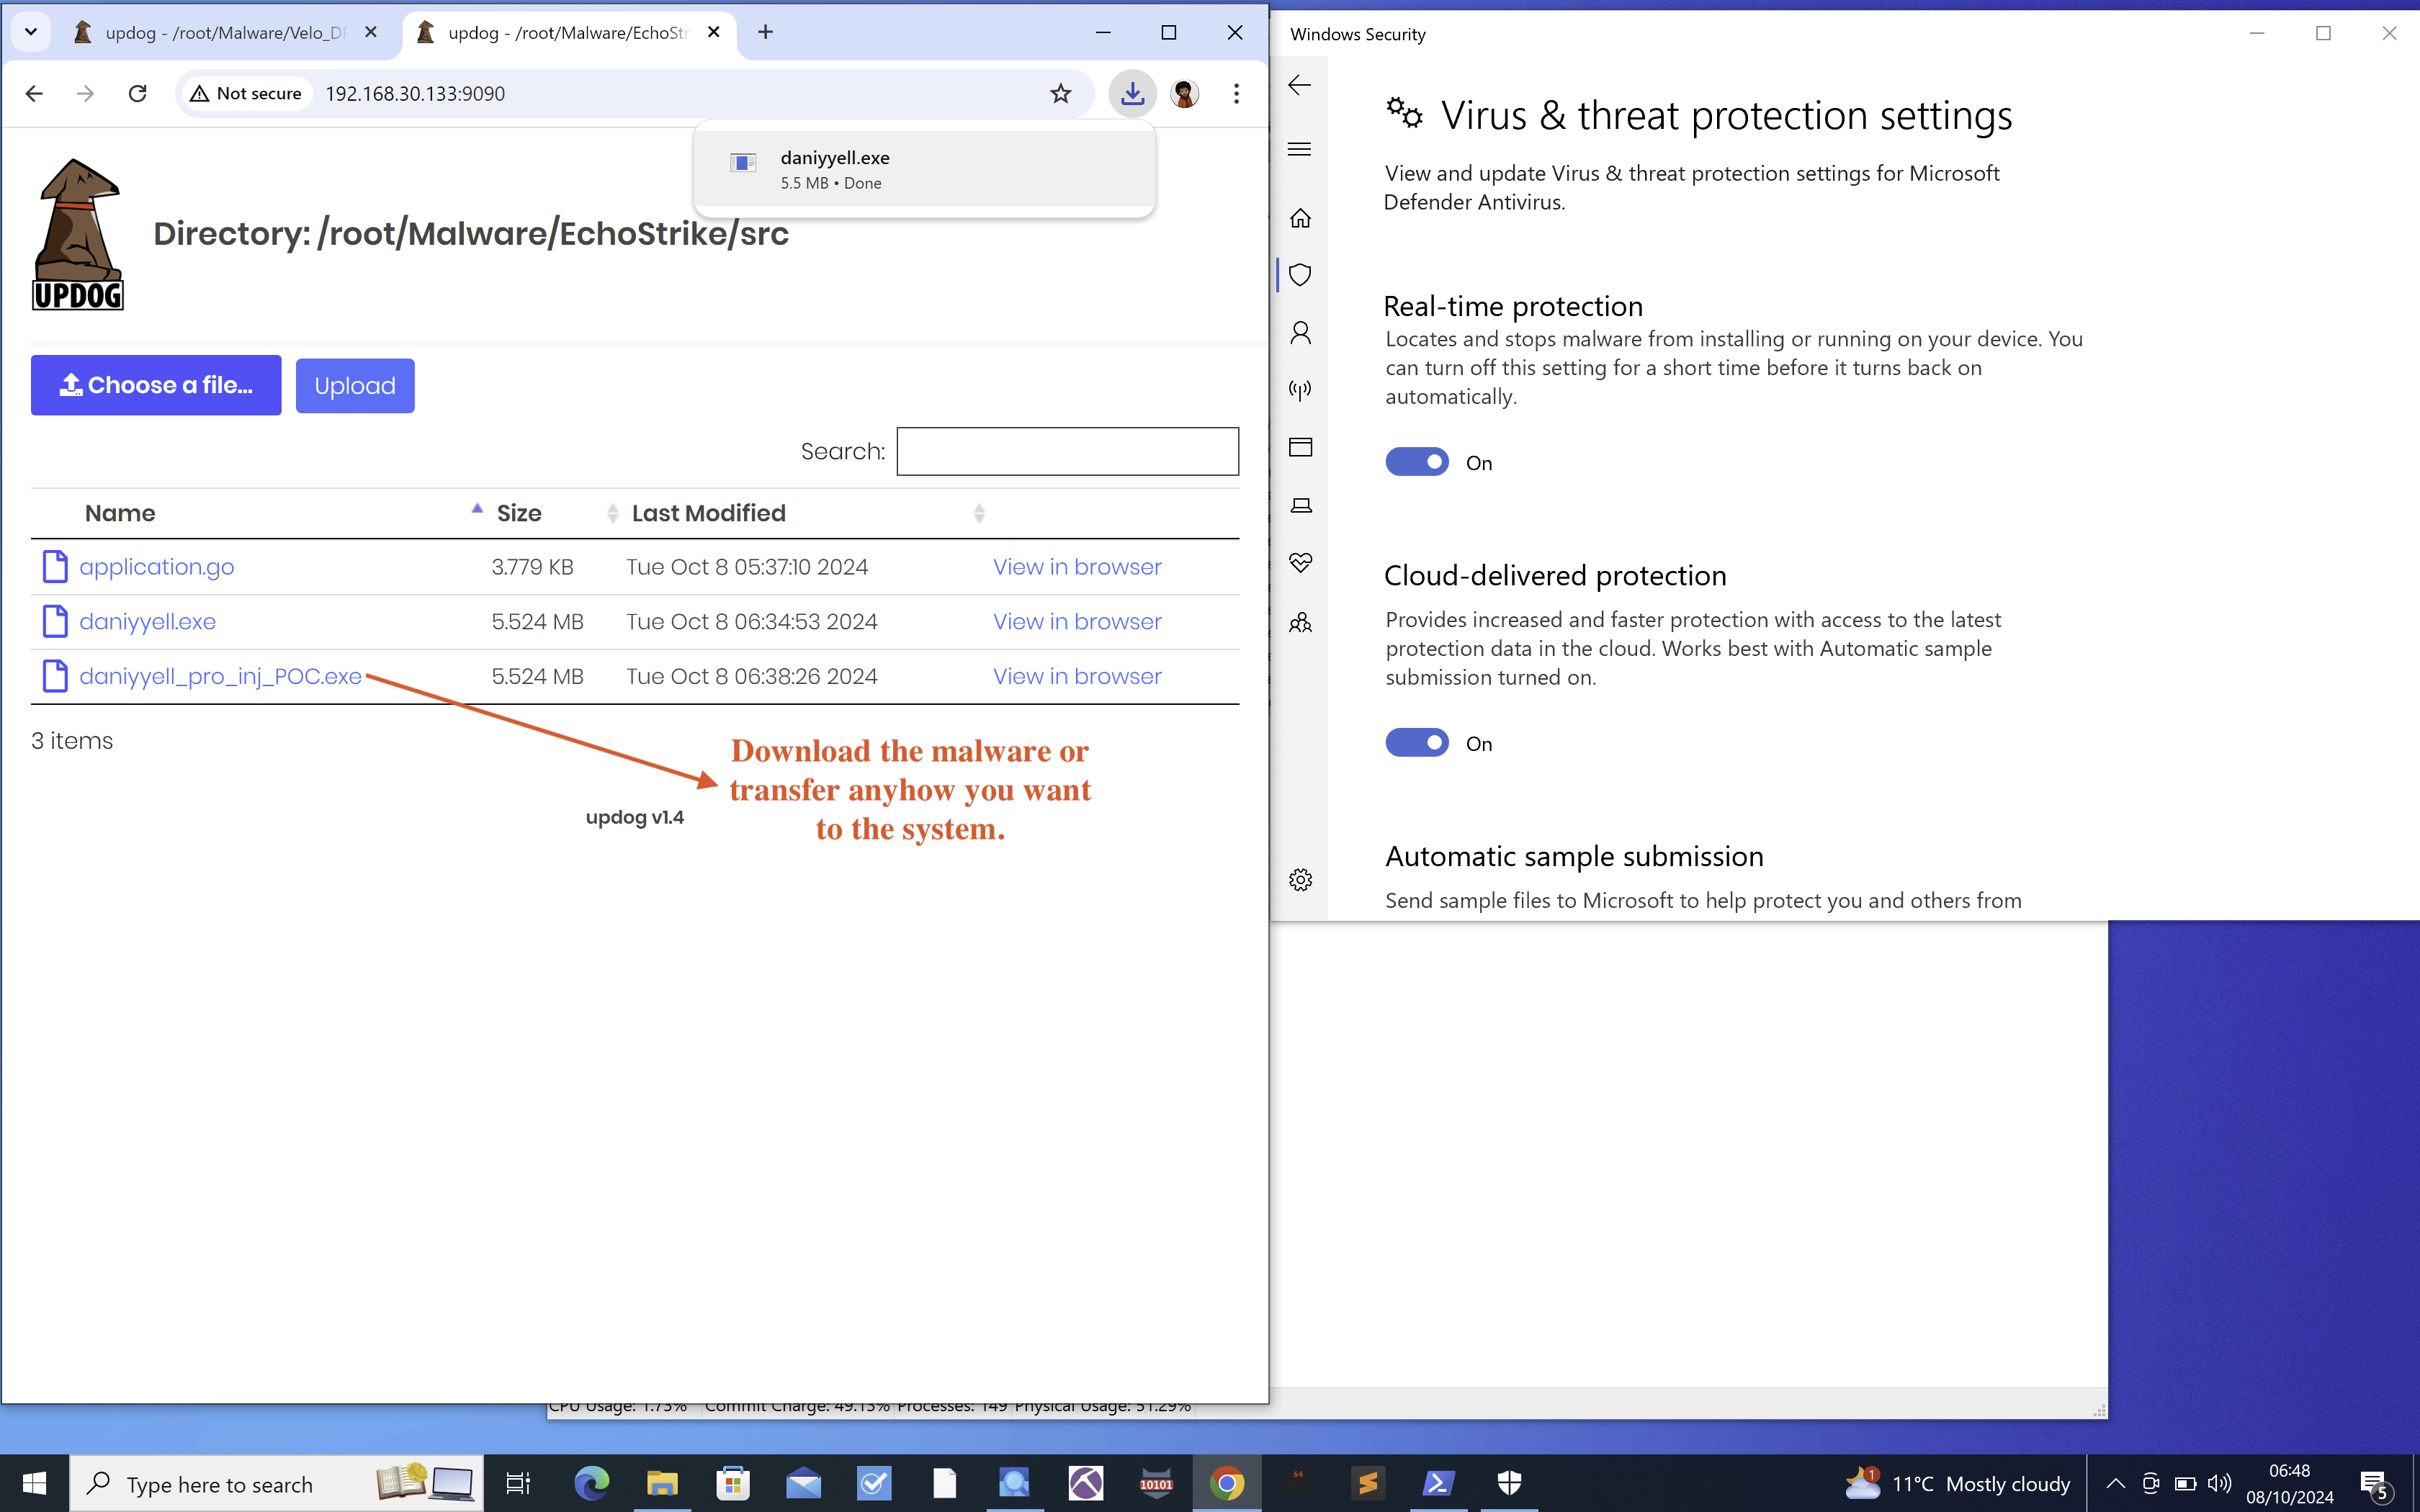
Fig 5: Download the malware
For this lab, ensure that the malware is using the process hollowing technique. However, bear in mind that Velociraptor can be used to hunt for a wide range of threats beyond this technique. For now, our focus will remain on process hollowing.
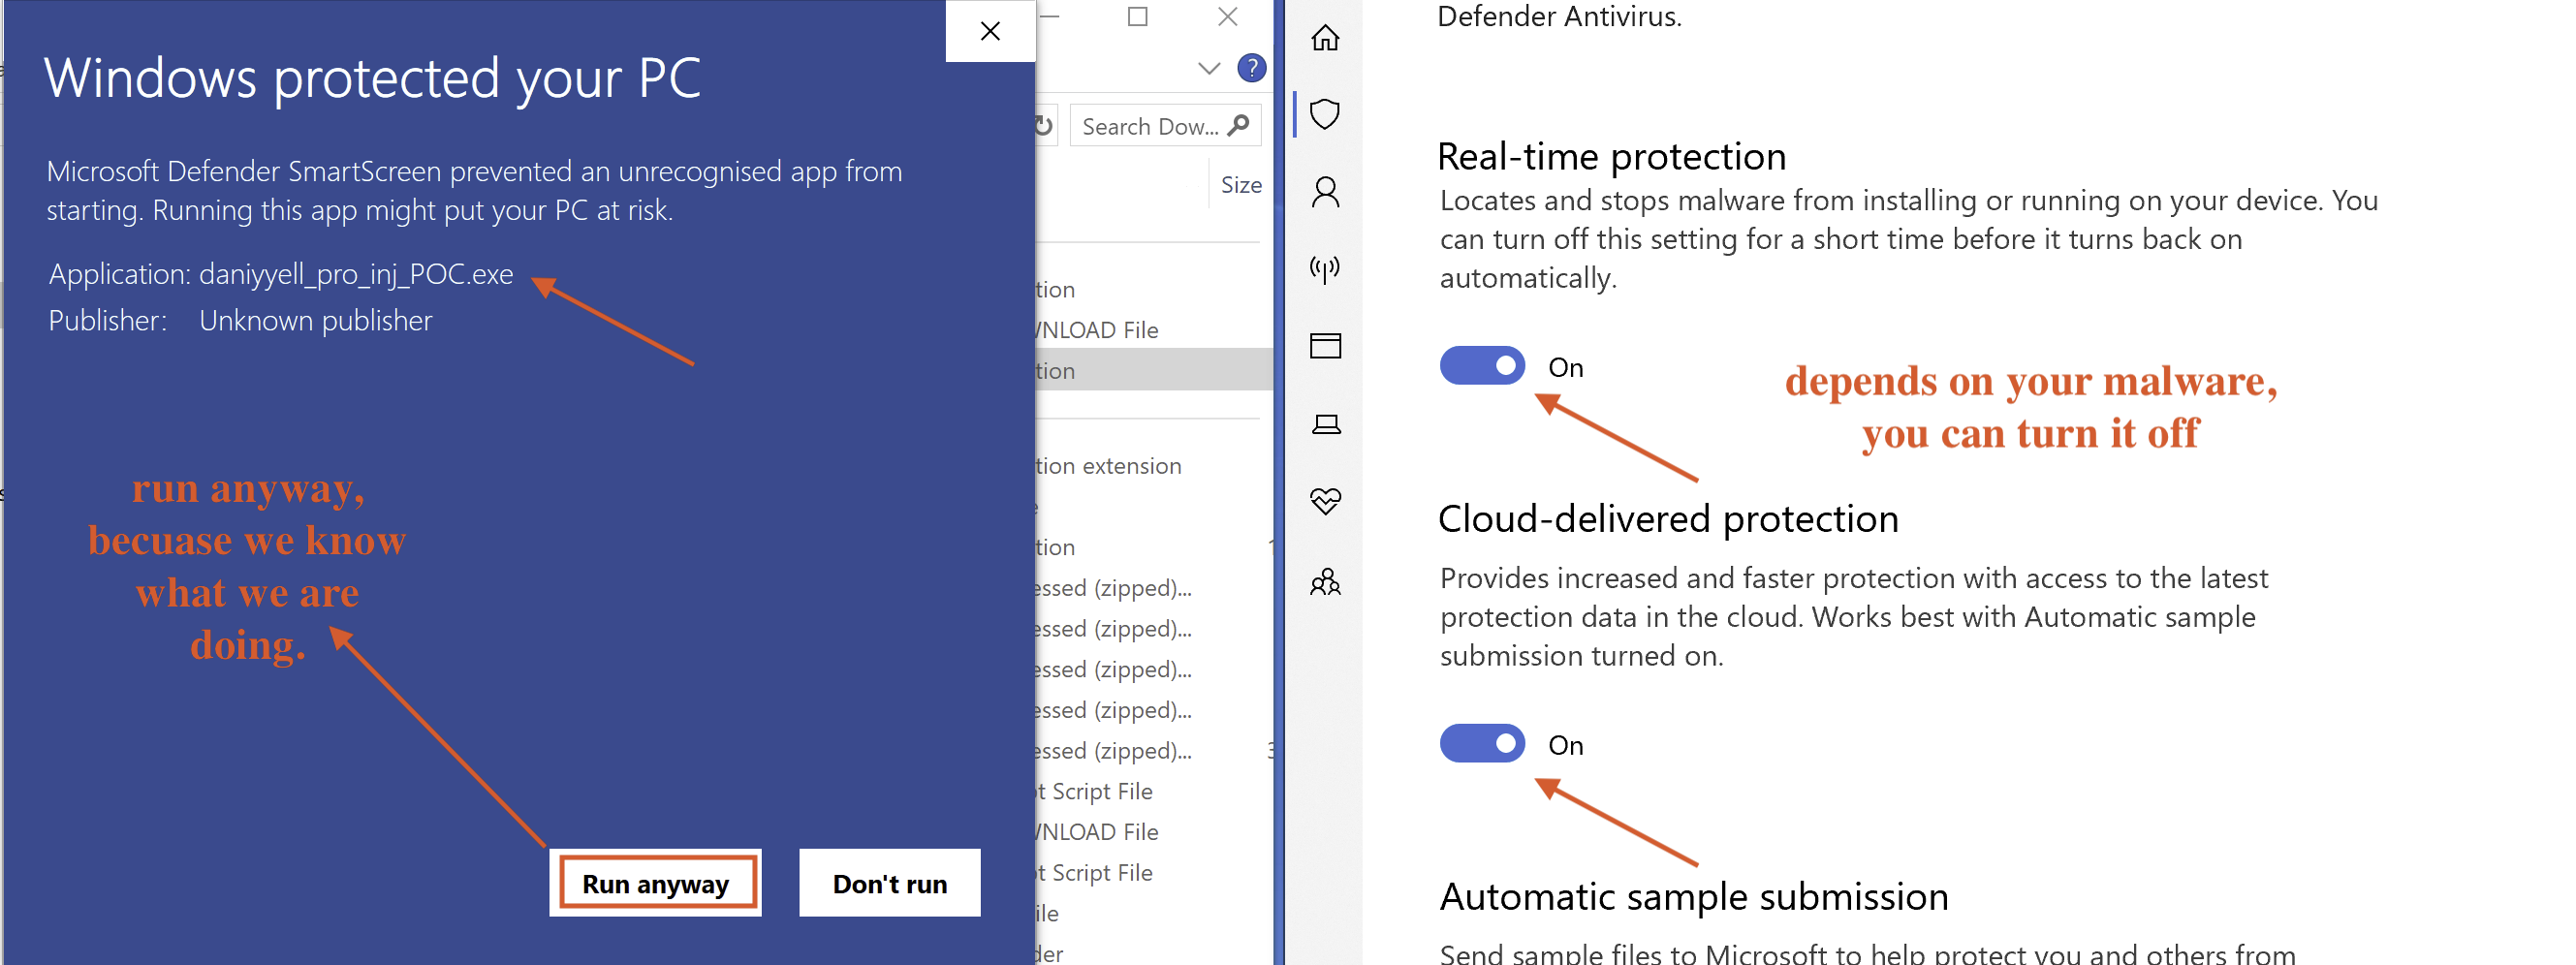
Fig 6: malware execution
Once the malware has been executed as shown in Fig 6, we can proceed with the hunt using Velociraptor.
Extracting Artefacts with Velociraptor
The next step involves extracting evidence of the attack or malware using Velociraptor. If you have correctly configured your Velociraptor clients and server, and the malware has been executed, you can begin the hunt. To start, click the “Hunt” button in the Velociraptor server, as shown in Fig 7.
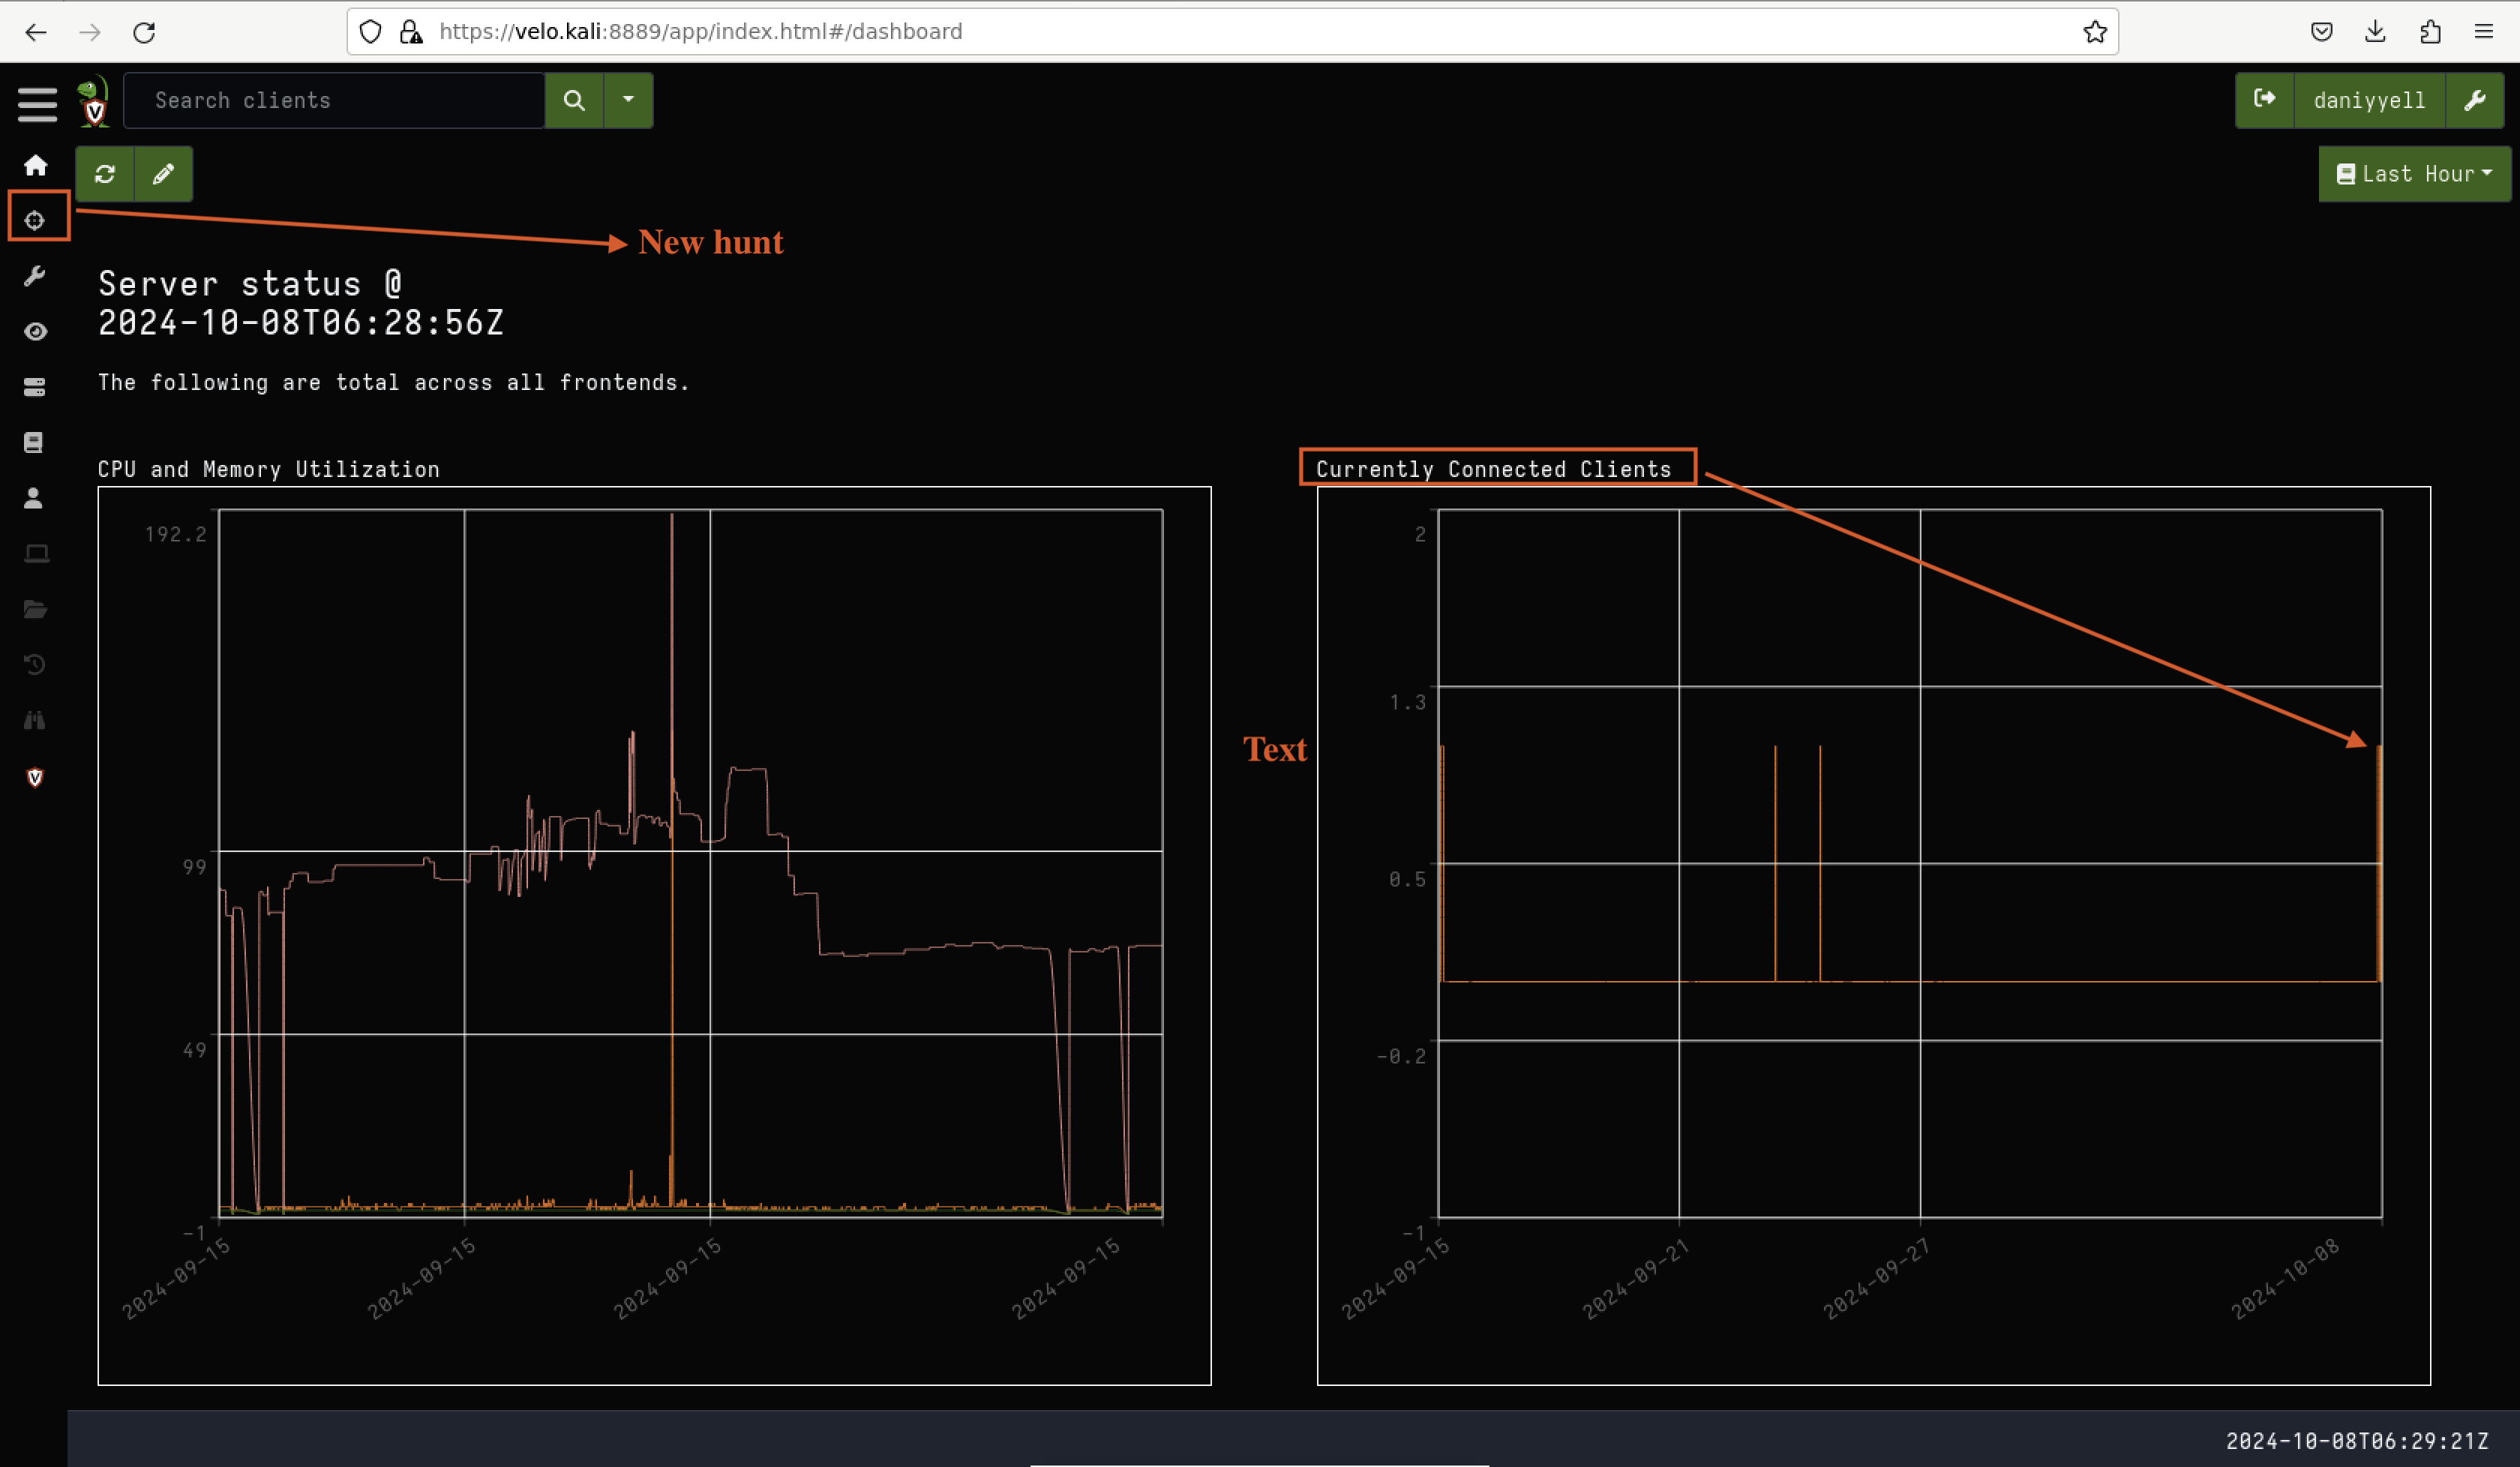
Fig 7: Let the hunt begin
Next, you’ll need to select your hunting packages. Velociraptor comes with a wide range of pre-installed artefacts that are ready to use. In this lab, we will use some of these artefact parameters, as shown in Fig 8.
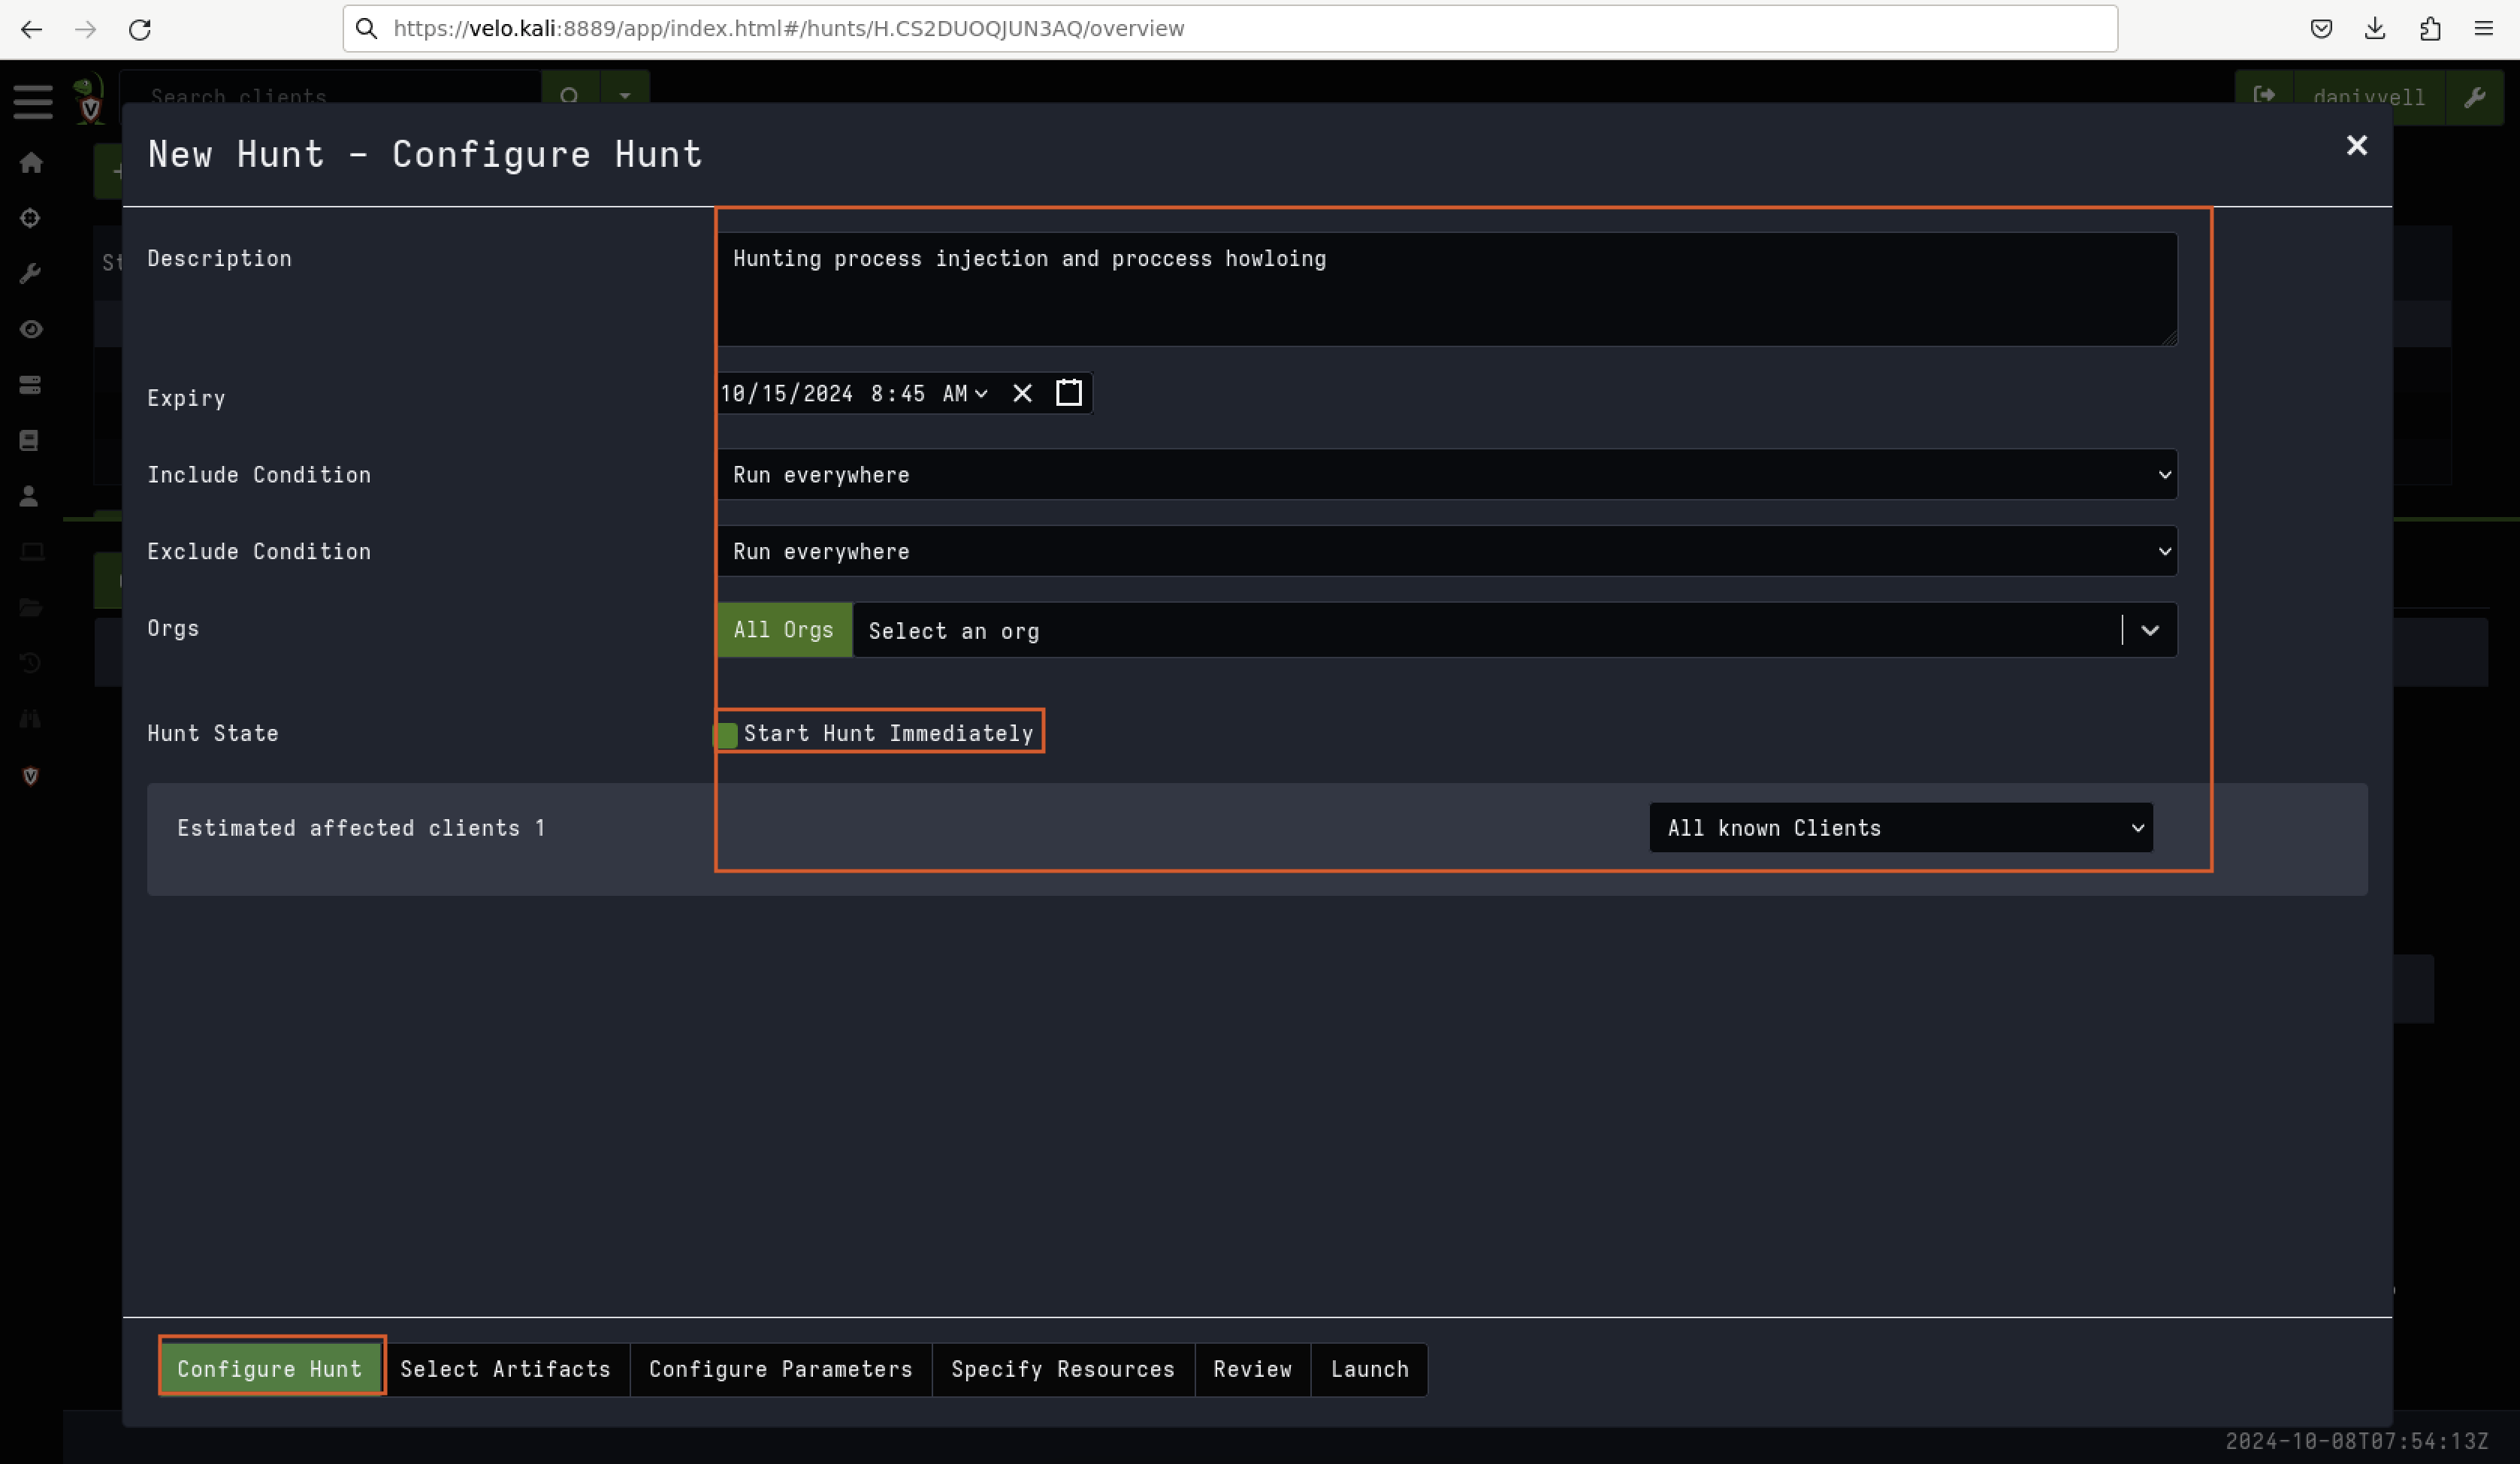
Fig 8: Configure Hunt
To search for the artefacts you want to use in your hunt, simply type their names into the search bar, as shown in Fig 9.
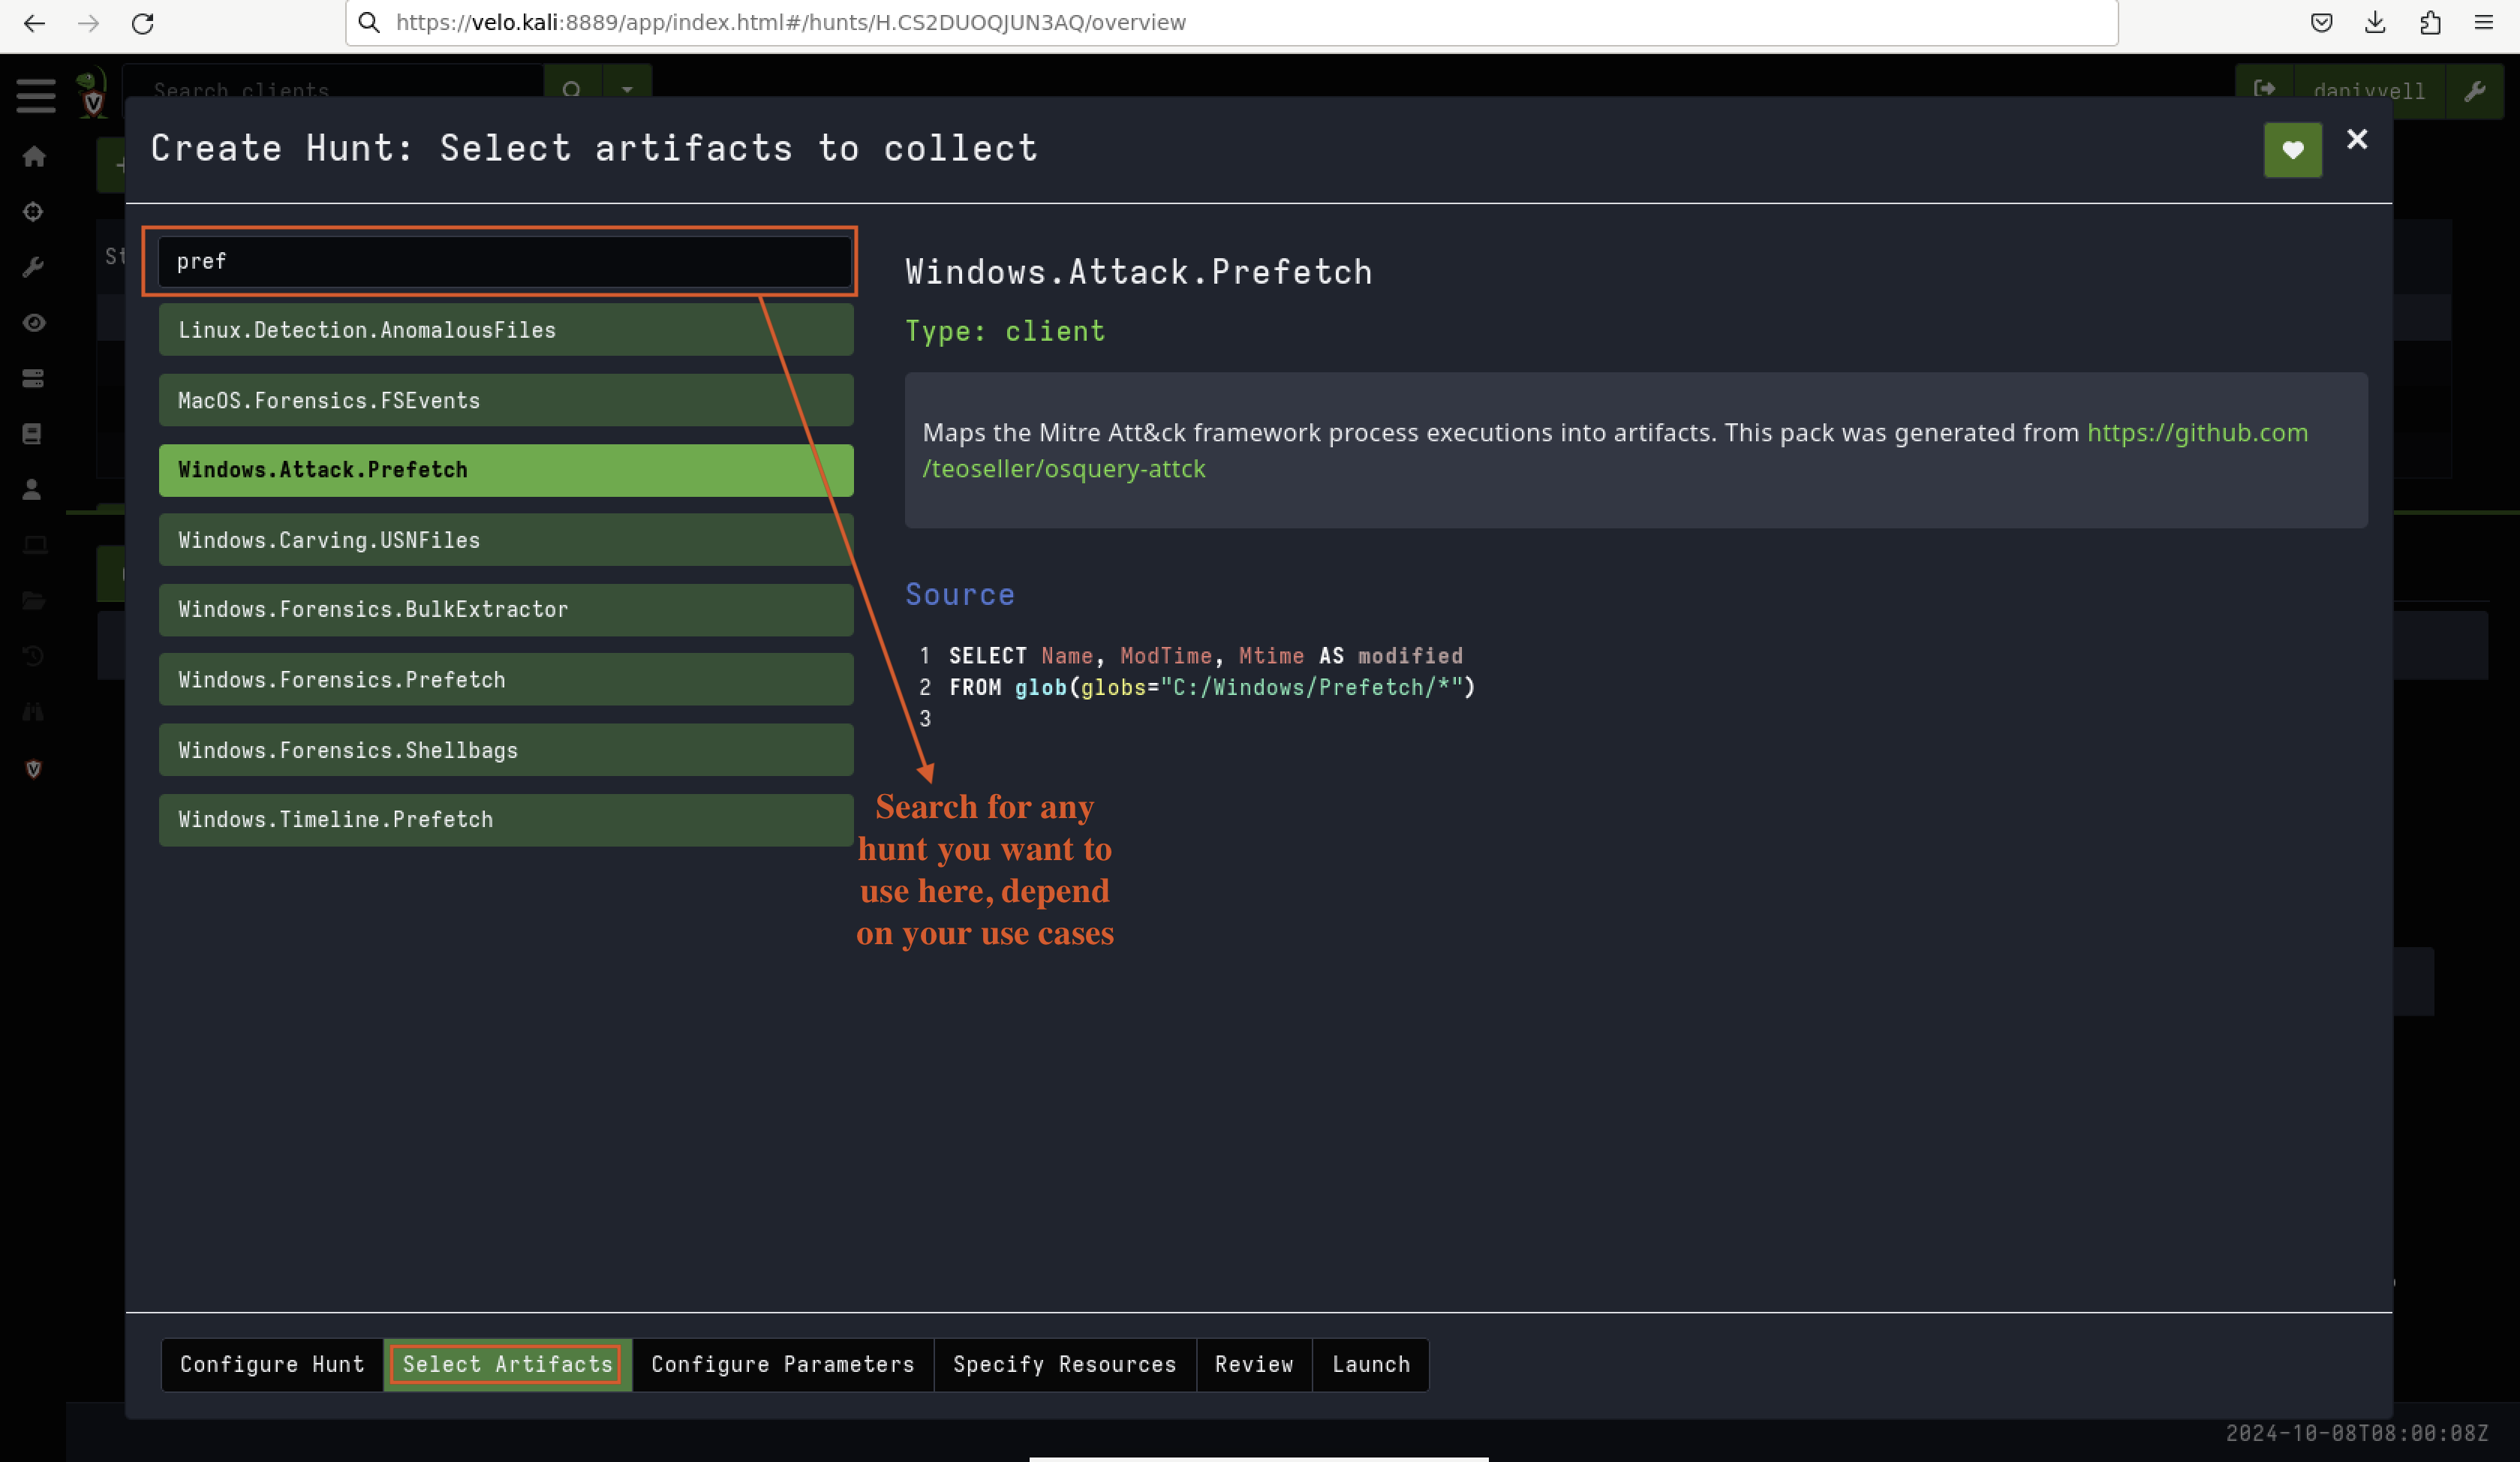
Fig 9: Search Hunt Artefacts
Artefacts Parameters for This Lab
In this lab, we will focus on the following artefacts as shown in Fig 10:
-
Windows.Memory.ProcessInfo: This artefact provides detailed information about running processes in memory. It allows us to see which processes are active, including their memory usage, identifiers, and other related information.
-
Windows.Memory.ProcessDump: This artefact captures the memory of a specific process, which can be used to analyse its behaviour, identify injected code, or find other malicious activity.
-
Generic.System.Pstree: This artefact shows the process tree, illustrating how processes are spawned and related to one another. It’s useful for identifying parent-child relationships between processes, especially when tracking malware.
-
Windows.System.Pslist: This artefact provides a list of all active processes in the system, including detailed information such as process IDs and associated user accounts.
-
Windows.Attack.Prefetch: This artefact focuses on Windows Prefetch data, which helps track recently executed applications. It’s useful for identifying whether a suspicious or malicious executable has run on the system.
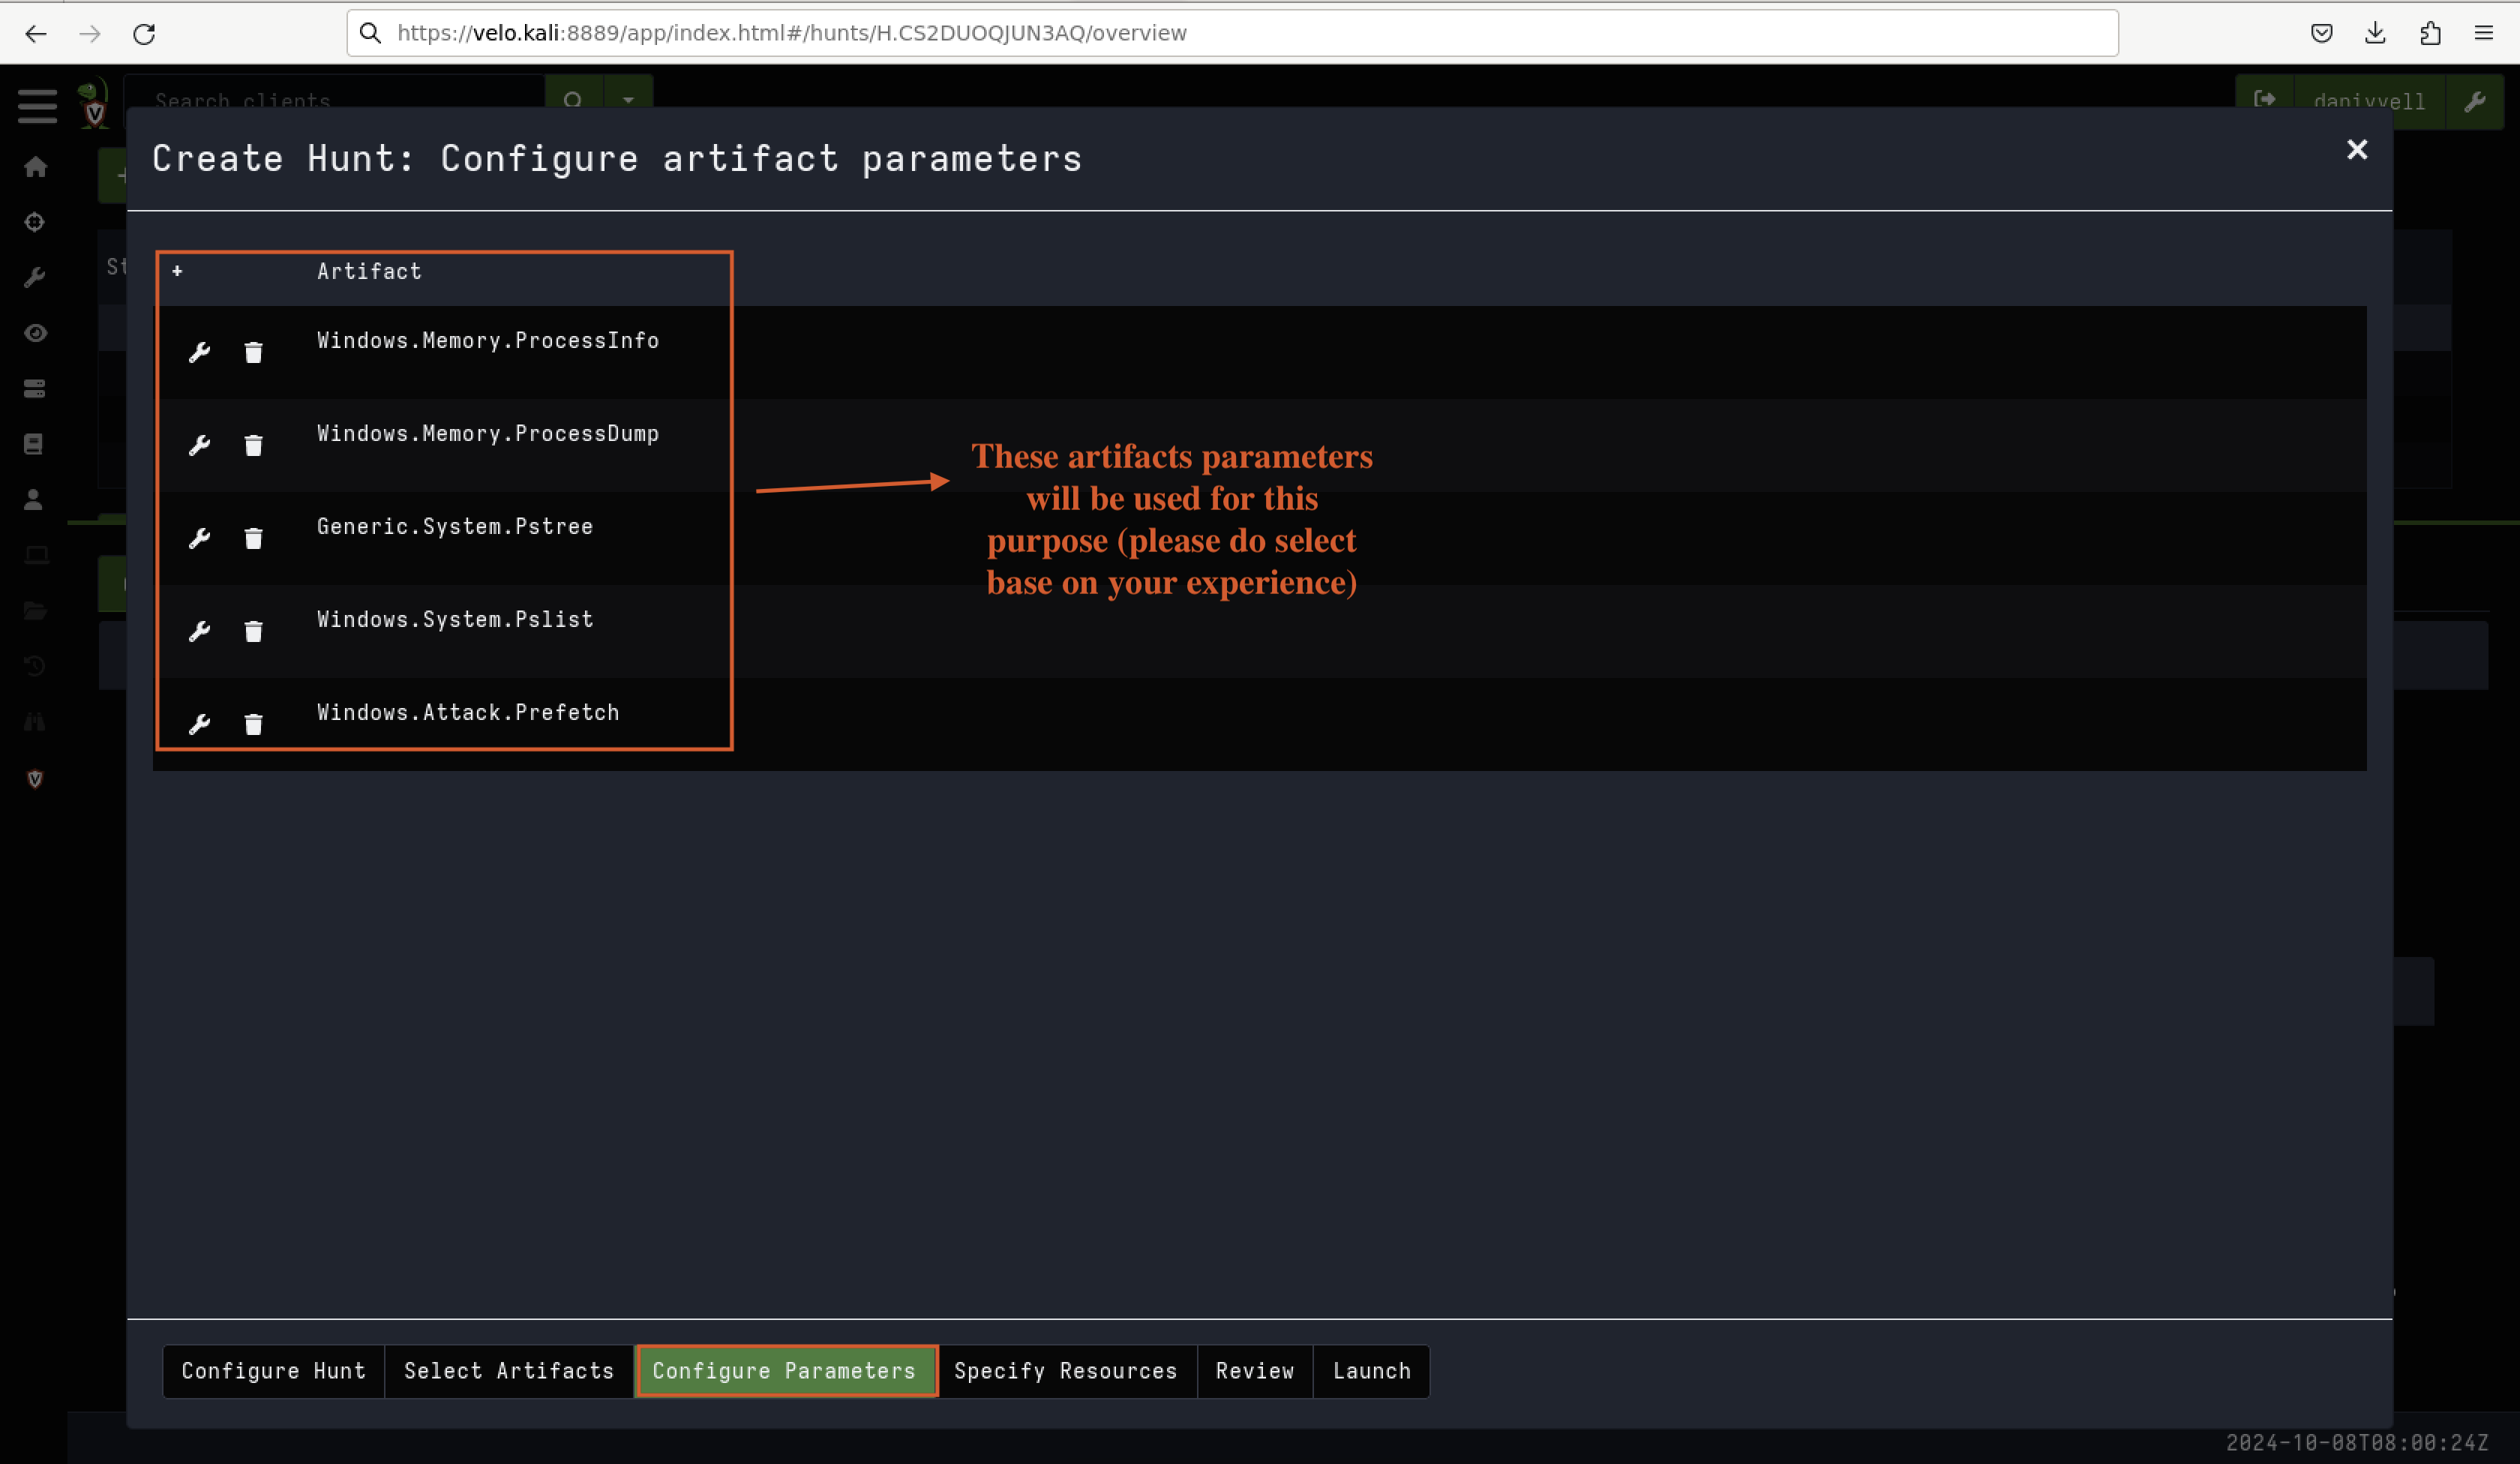
Figure 10: Selected Artefacts
These artefacts will assist in tracing the malicious activity, particularly focusing on the process hollowing technique used by the malware in this scenario.
Once the artefacts have been selected, it is essential to review them, as demonstrated in Fig 11.
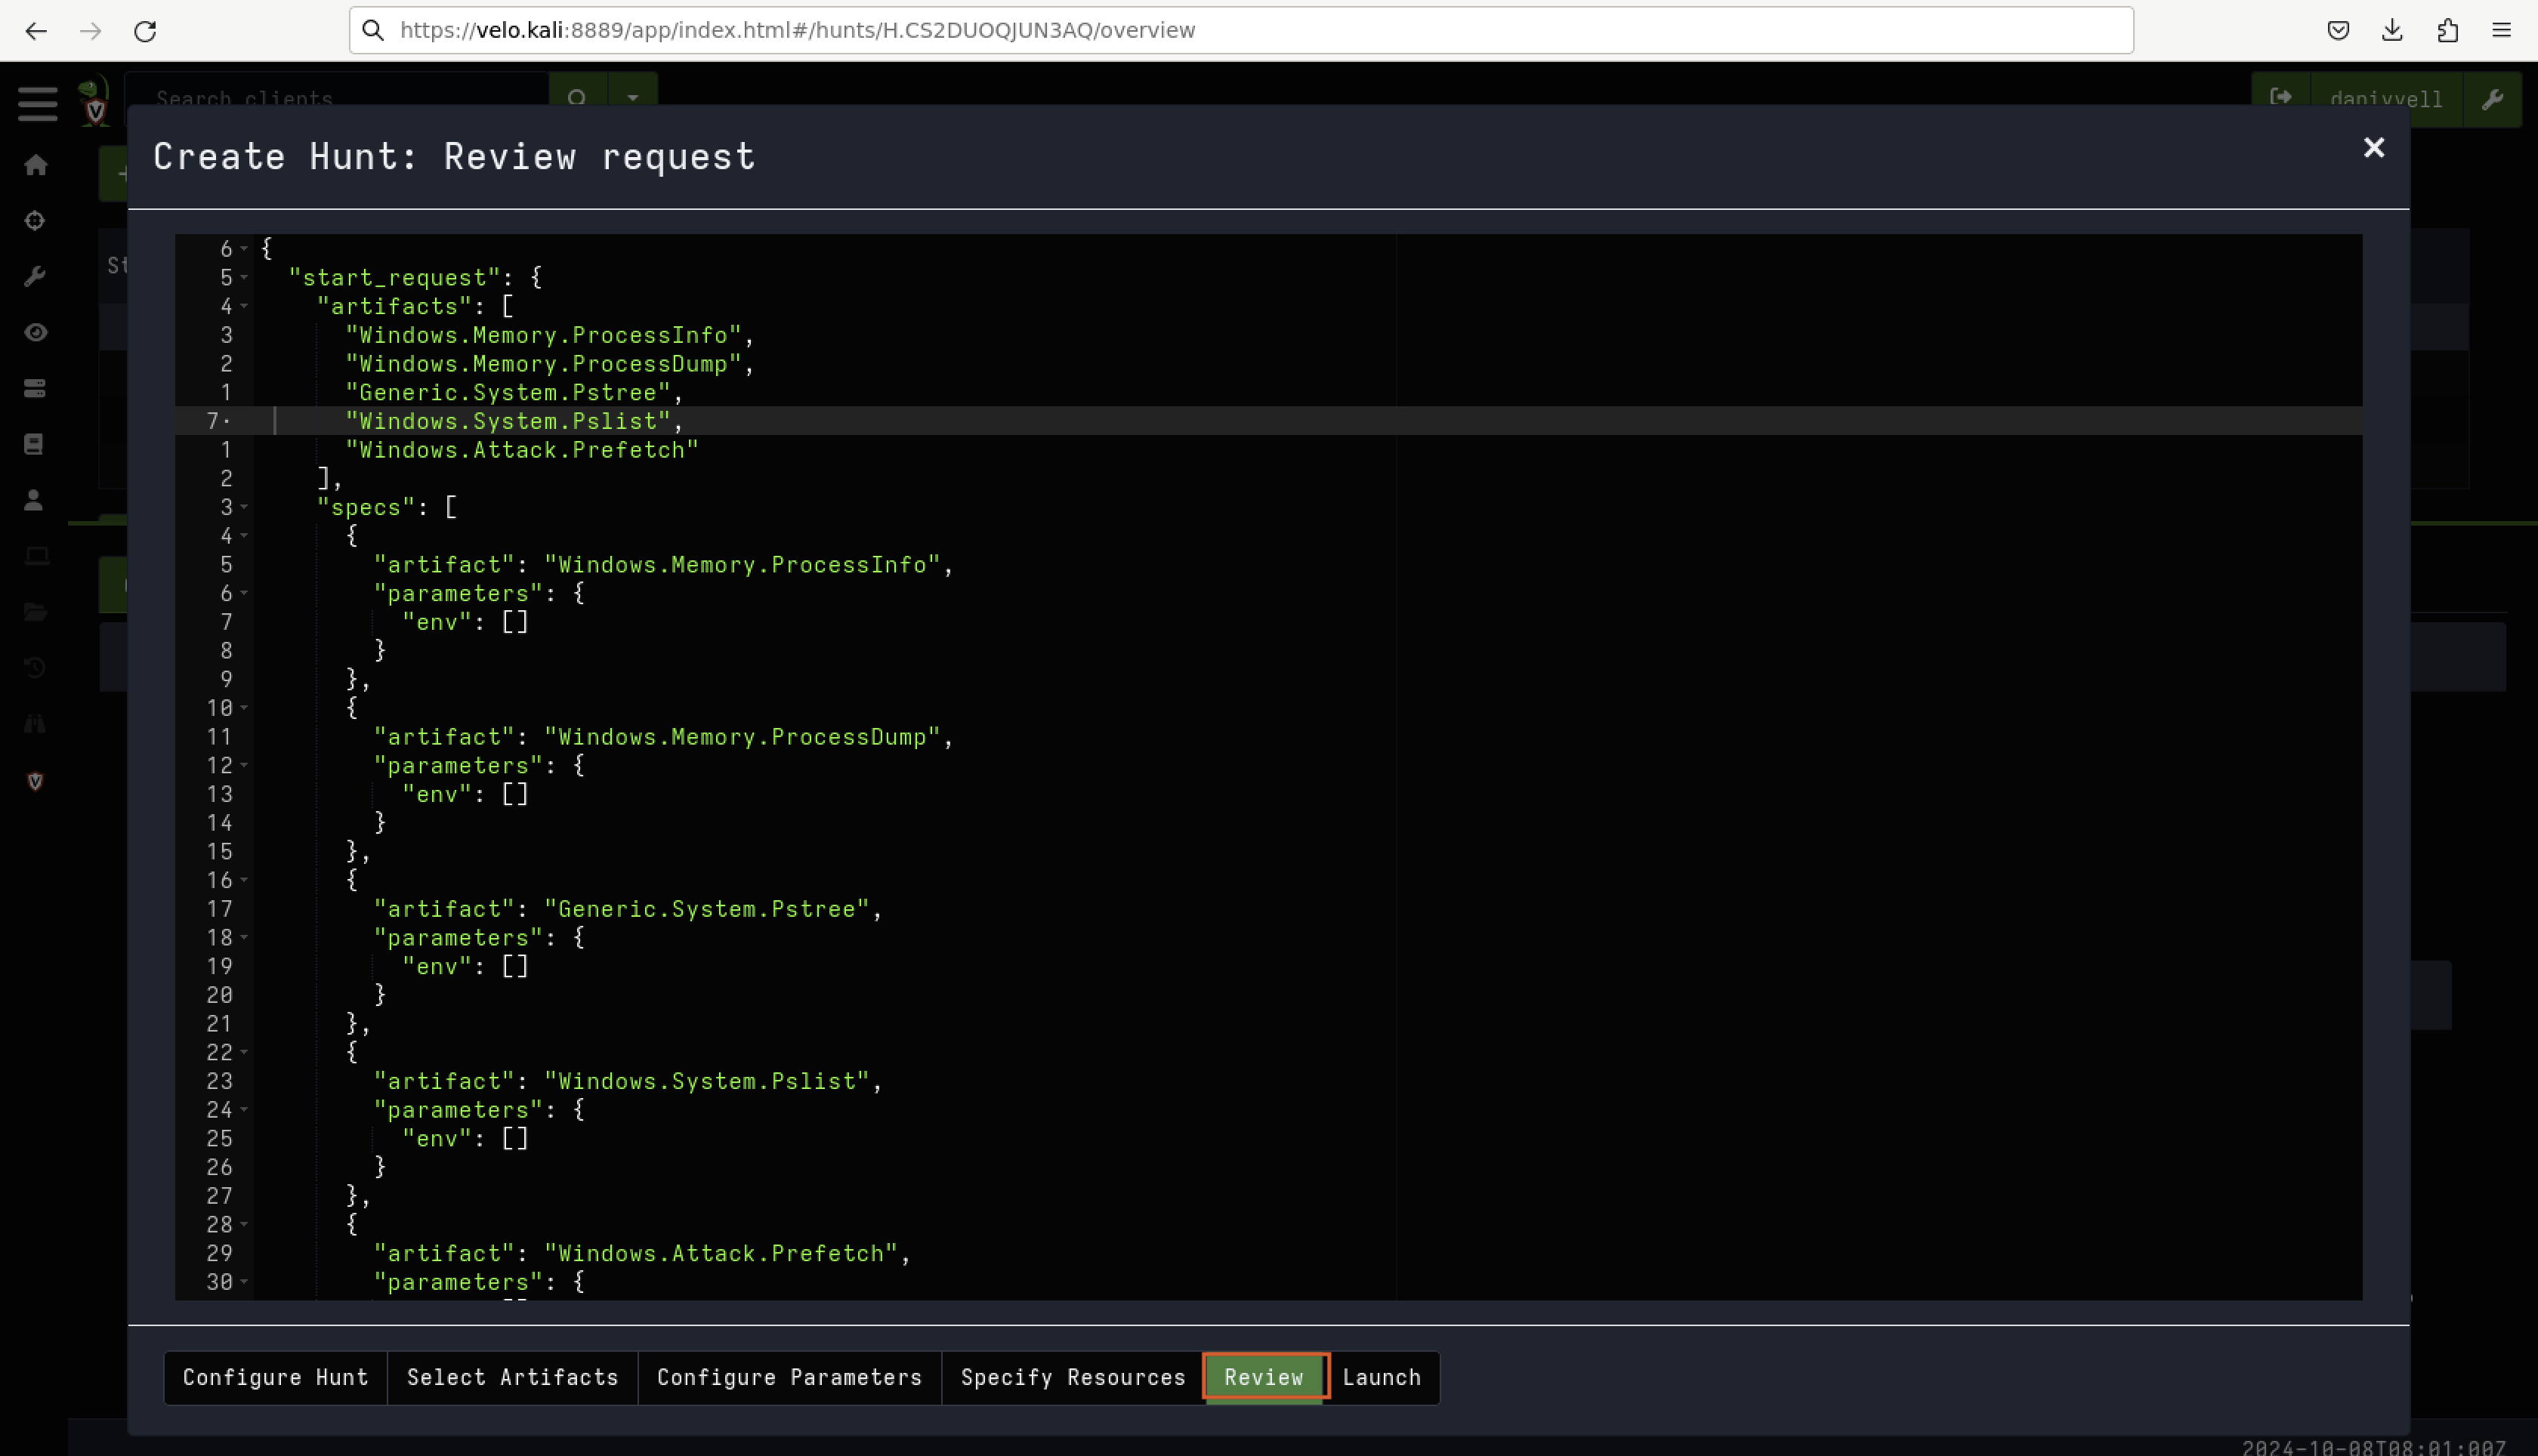
Fig 11: Review Selected Artefacts
After reviewing and selecting all the necessary hunting artefacts, you will be presented with a summary in the “Overview” section, as seen in Fig 12.
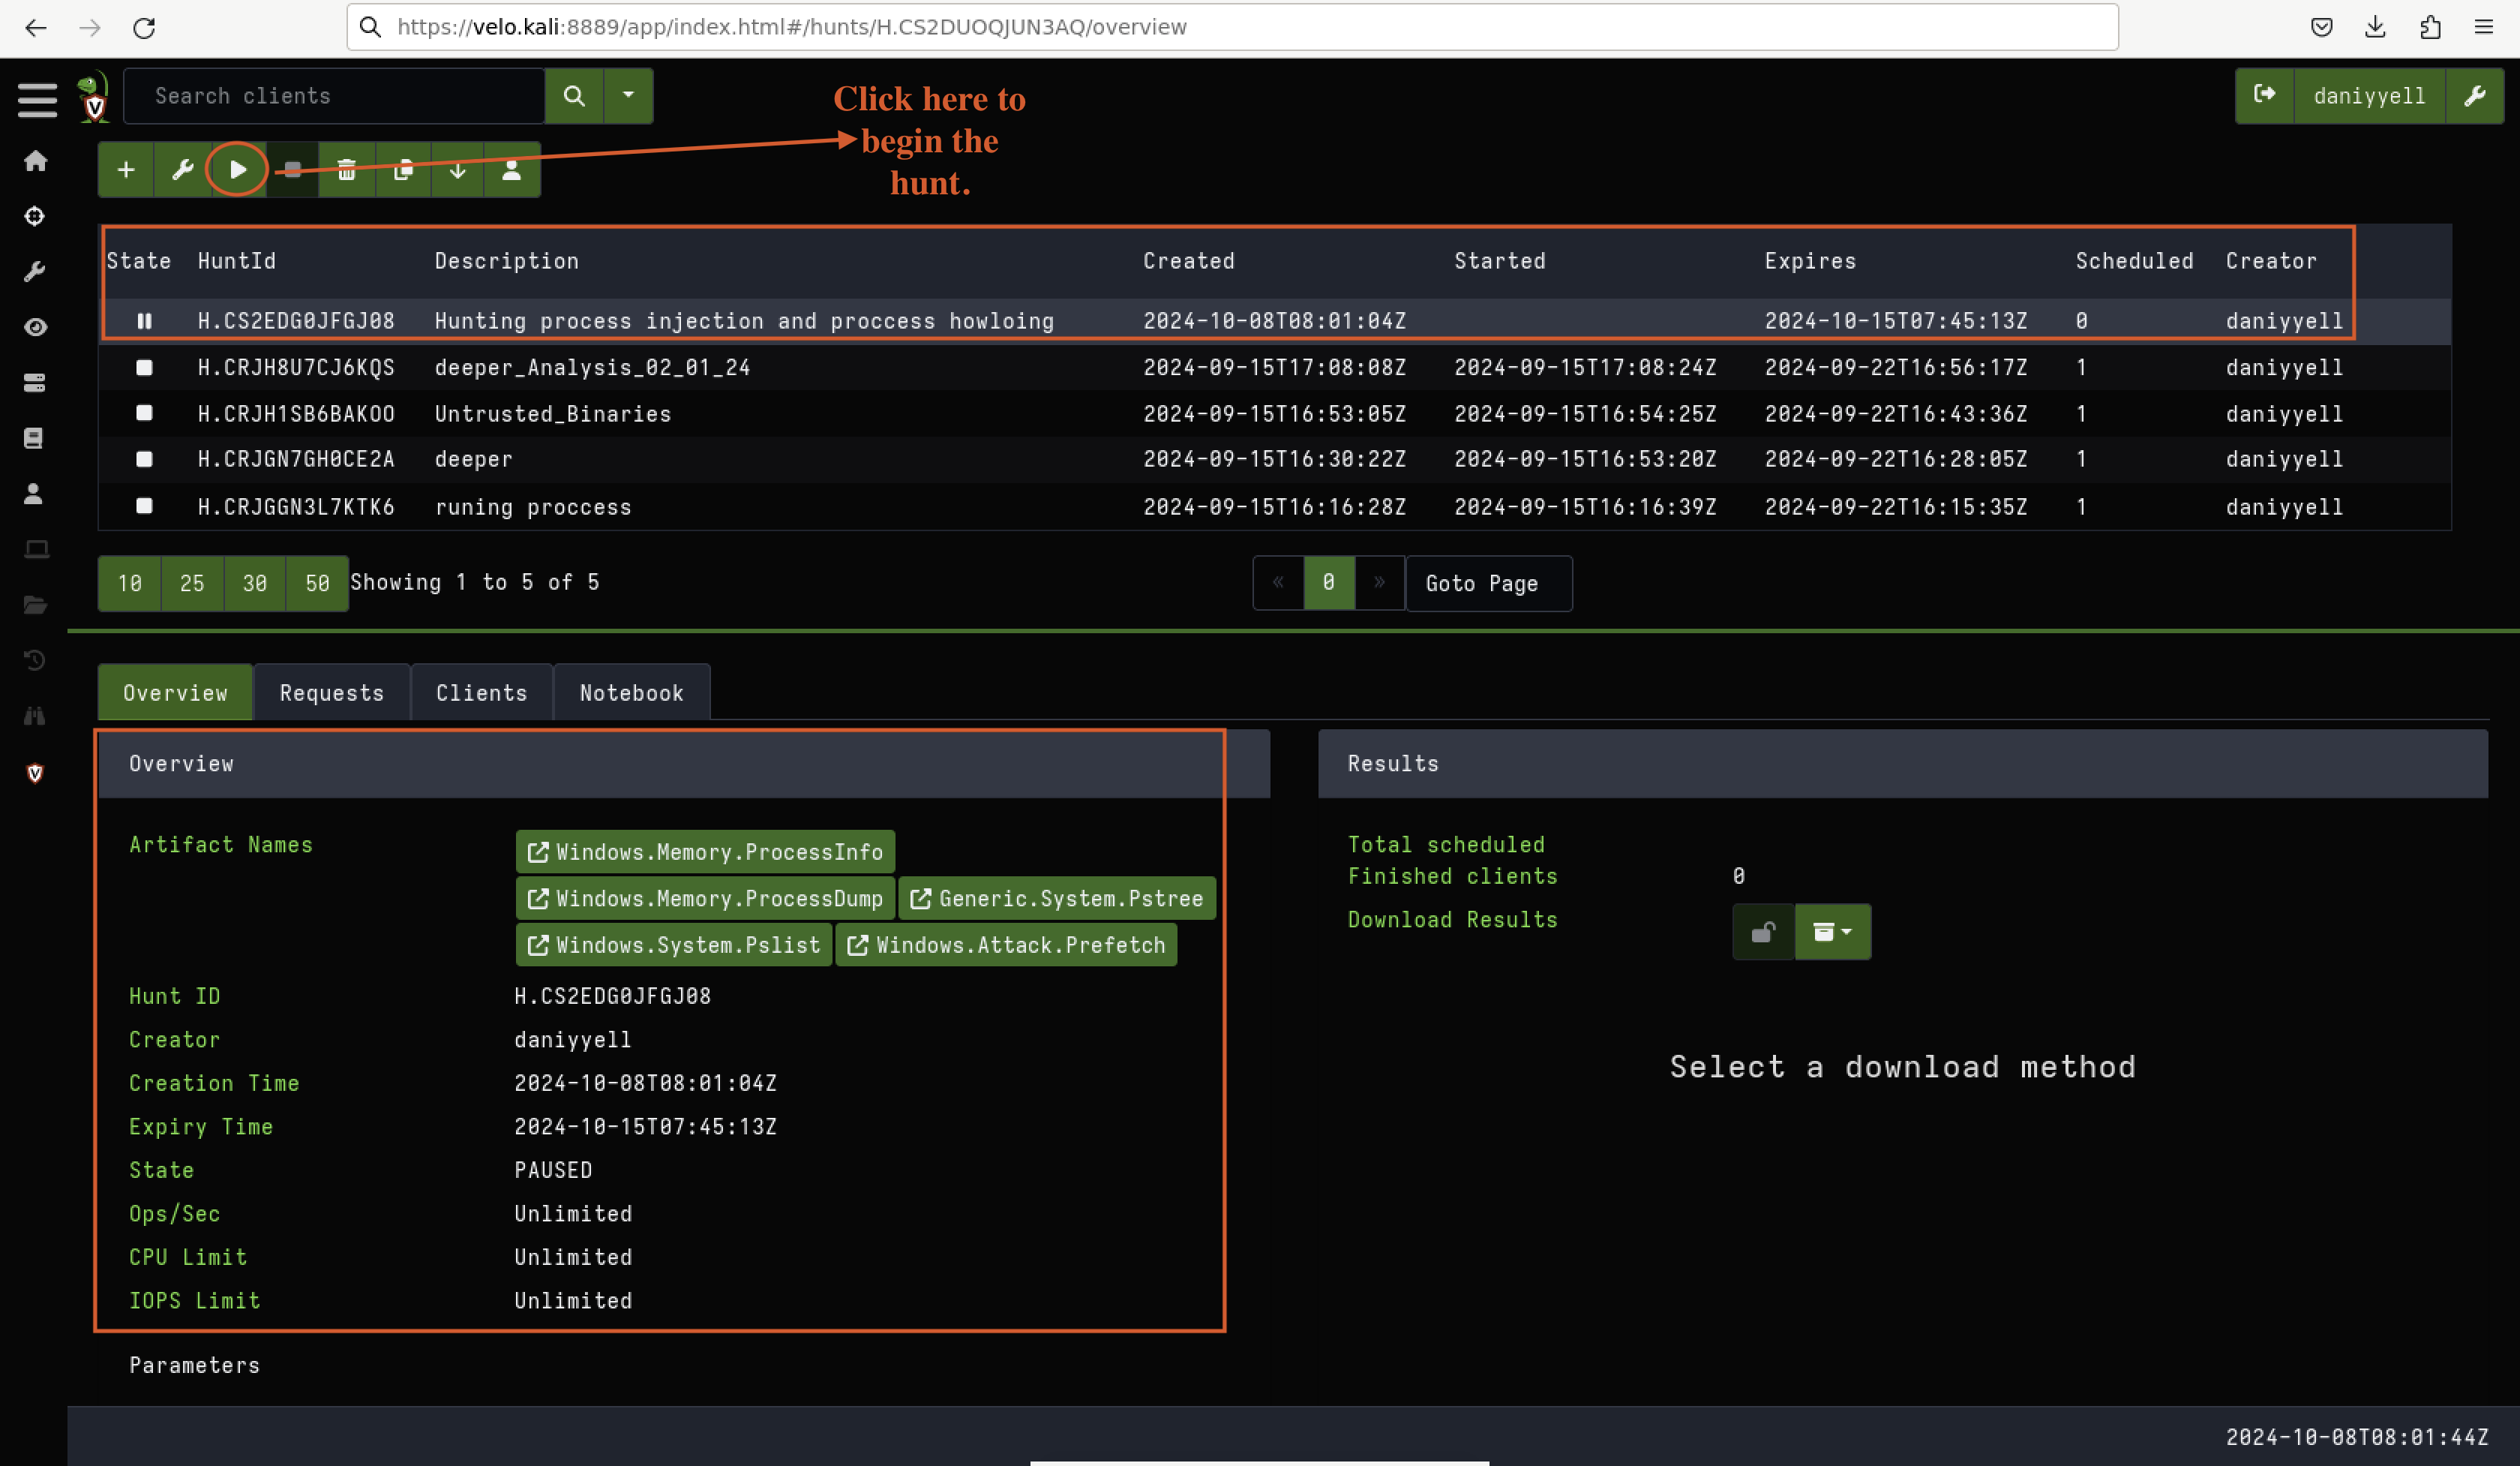 From there, simply click the “Run Hunt” button to initiate the process.
Fig 12: Begin the Hunt
It’s also important to ensure that the client is connected before proceeding. This can be confirmed in the client list, as shown in Fig 13.

Fig 13: Checking if Client is Connected
After a few minutes, all the artefacts will be collected and available for analysis. This is illustrated in Fig 14.
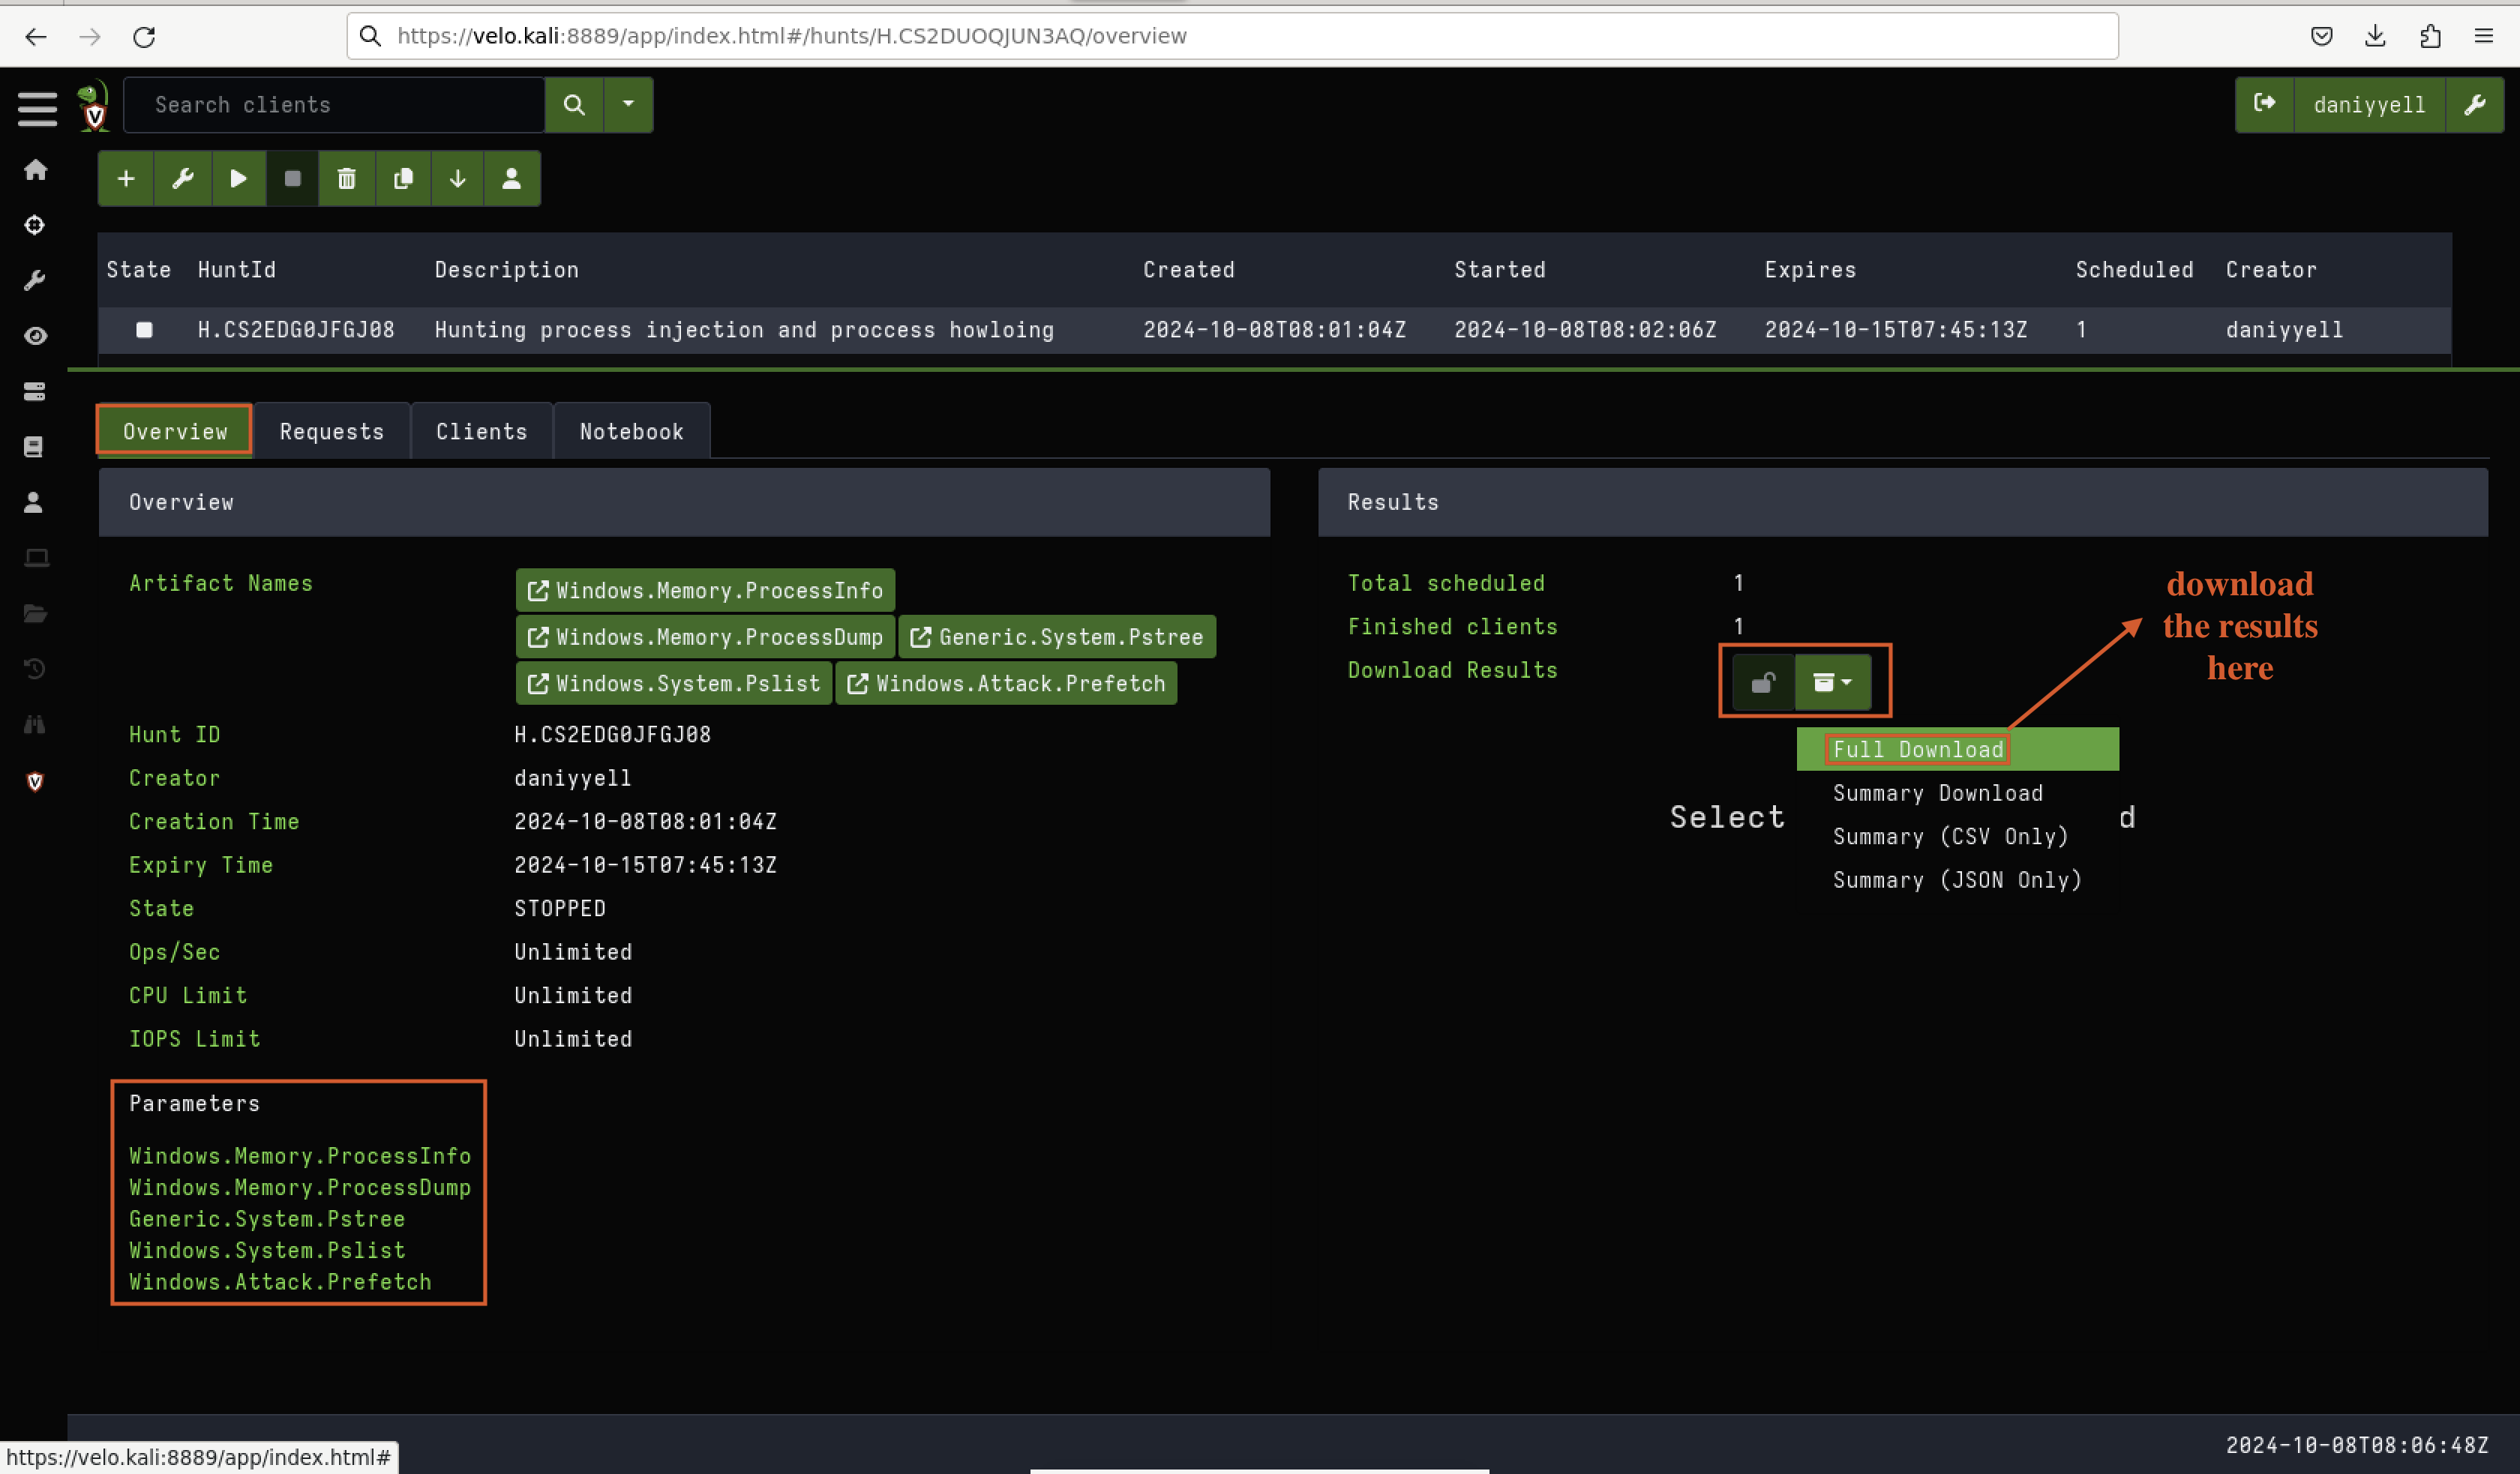
Fig 14: Artefacts are now available for download
Moving the Artefacts to a Desired Location
At this stage, we can move the collected artefacts to another location or share them with other security analysts or colleagues, depending on the situation. In this lab, we have renamed the artefact to “Process_Injection_v1.zip”, as demonstrated in Fig 15.
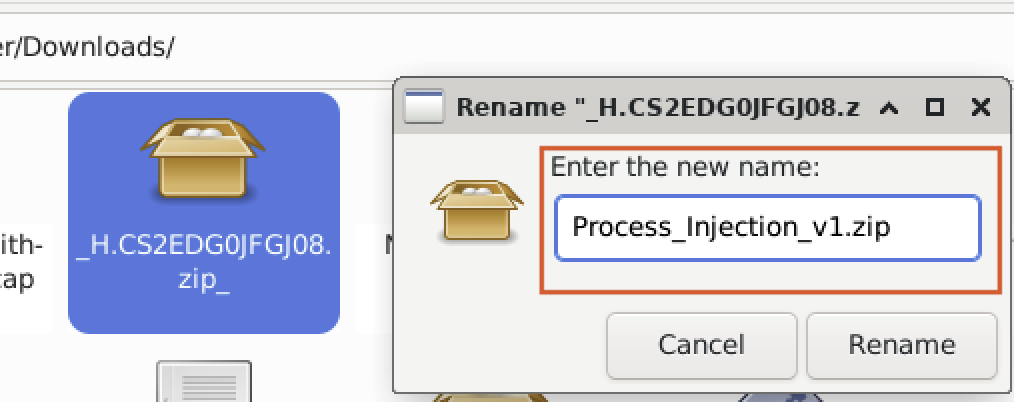
Fig 15: Renaming the Artefacts
In line with best practices, when moving artefacts to another location, it’s crucial to secure the file by adding a password. This ensures the artefact’s integrity and confidentiality. In this lab, we have applied a password to the zip file, as shown in Fig 16.

Fig 16: Passwording the Artefact Zip File
Analysing the Results
After the artefacts have been collected and moved to the desired location, the next critical step is to analyse the results. There are various ways to approach this, and often it depends on the experience and preferences of the analyst. Some individuals prefer to feed the artefacts directly into a SIEM (Security Information and Event Management) system to automate the correlation and detection process, while others may choose to manually piece together the information for a more hands-on approach. Python scripts are also commonly used to extract insights from the CSV files generated by Velociraptor, allowing for more customised analysis.
In this lab, however, we will take a manual approach to the artefact analysis. This method ensures a deeper understanding of the data and helps to develop the skills required to detect and dissect malware behaviour without relying solely on automated tools. In my experience, it’s always beneficial to go through the process manually before leaning on automation tools to solve the problem. Taking the time to manually analyse artefacts not only sharpens an analyst’s ability to identify patterns but also fosters a more intuitive grasp of the underlying techniques employed by the malware, such as process hollowing in this scenario.
Evidence correlation
At this stage, it is crucial to correlate evidence from various artefacts to build a comprehensive understanding of the suspicious activity observed. By analysing multiple artefacts, we can piece together a fuller picture.
1. Generic.System.Pstree Results
As mentioned at the beginning of this blog, we are approaching this scenario as if we already suspect malware on the victim machine. In a real-world situation, the process might not be as straightforward as demonstrated in this lab, but the mentality and approach remain the same.
In this section, we will analyse the results from the Generic.System.Pstree artefact and determine if anything seems out of the ordinary. At this point, we are operating in a somewhat blind or “grey” mode because, although we know malware was executed, we are proceeding as though we are not sure yet. In contrast, typical threat hunting often involves searching for anomalies or suspicious behaviour that might have been overlooked by traditional security measures. It’s about digging deeper to identify subtle signs of compromise, even if they appear normal at first glance.
Being curious and having a deep understanding of your organisation’s environment is crucial. Knowing what you are looking for and being specific in your hunt helps tremendously. In this scenario, we have a clear goal: we are looking for evidence of process hollowing, where one process disguises itself as another. In simple terms, we aim to find the malware that is masquerading as a legitimate process.
Deep Analysis of the Generic.System.Pstree Results
In this section, we will perform an in-depth analysis of the Generic.System.Pstree artefact. The process tree provides vital insight into the parent-child relationships between processes, which can help us identify suspicious activities, such as process injection or process hollowing.
Investigating “daniyyell_pro_inj_POC.exe”
Looking into the artefacts, at line 55, we observe an entry related to a potentially suspicious executable, daniyyell_pro_inj_POC.exe, as shown in Fig 17.
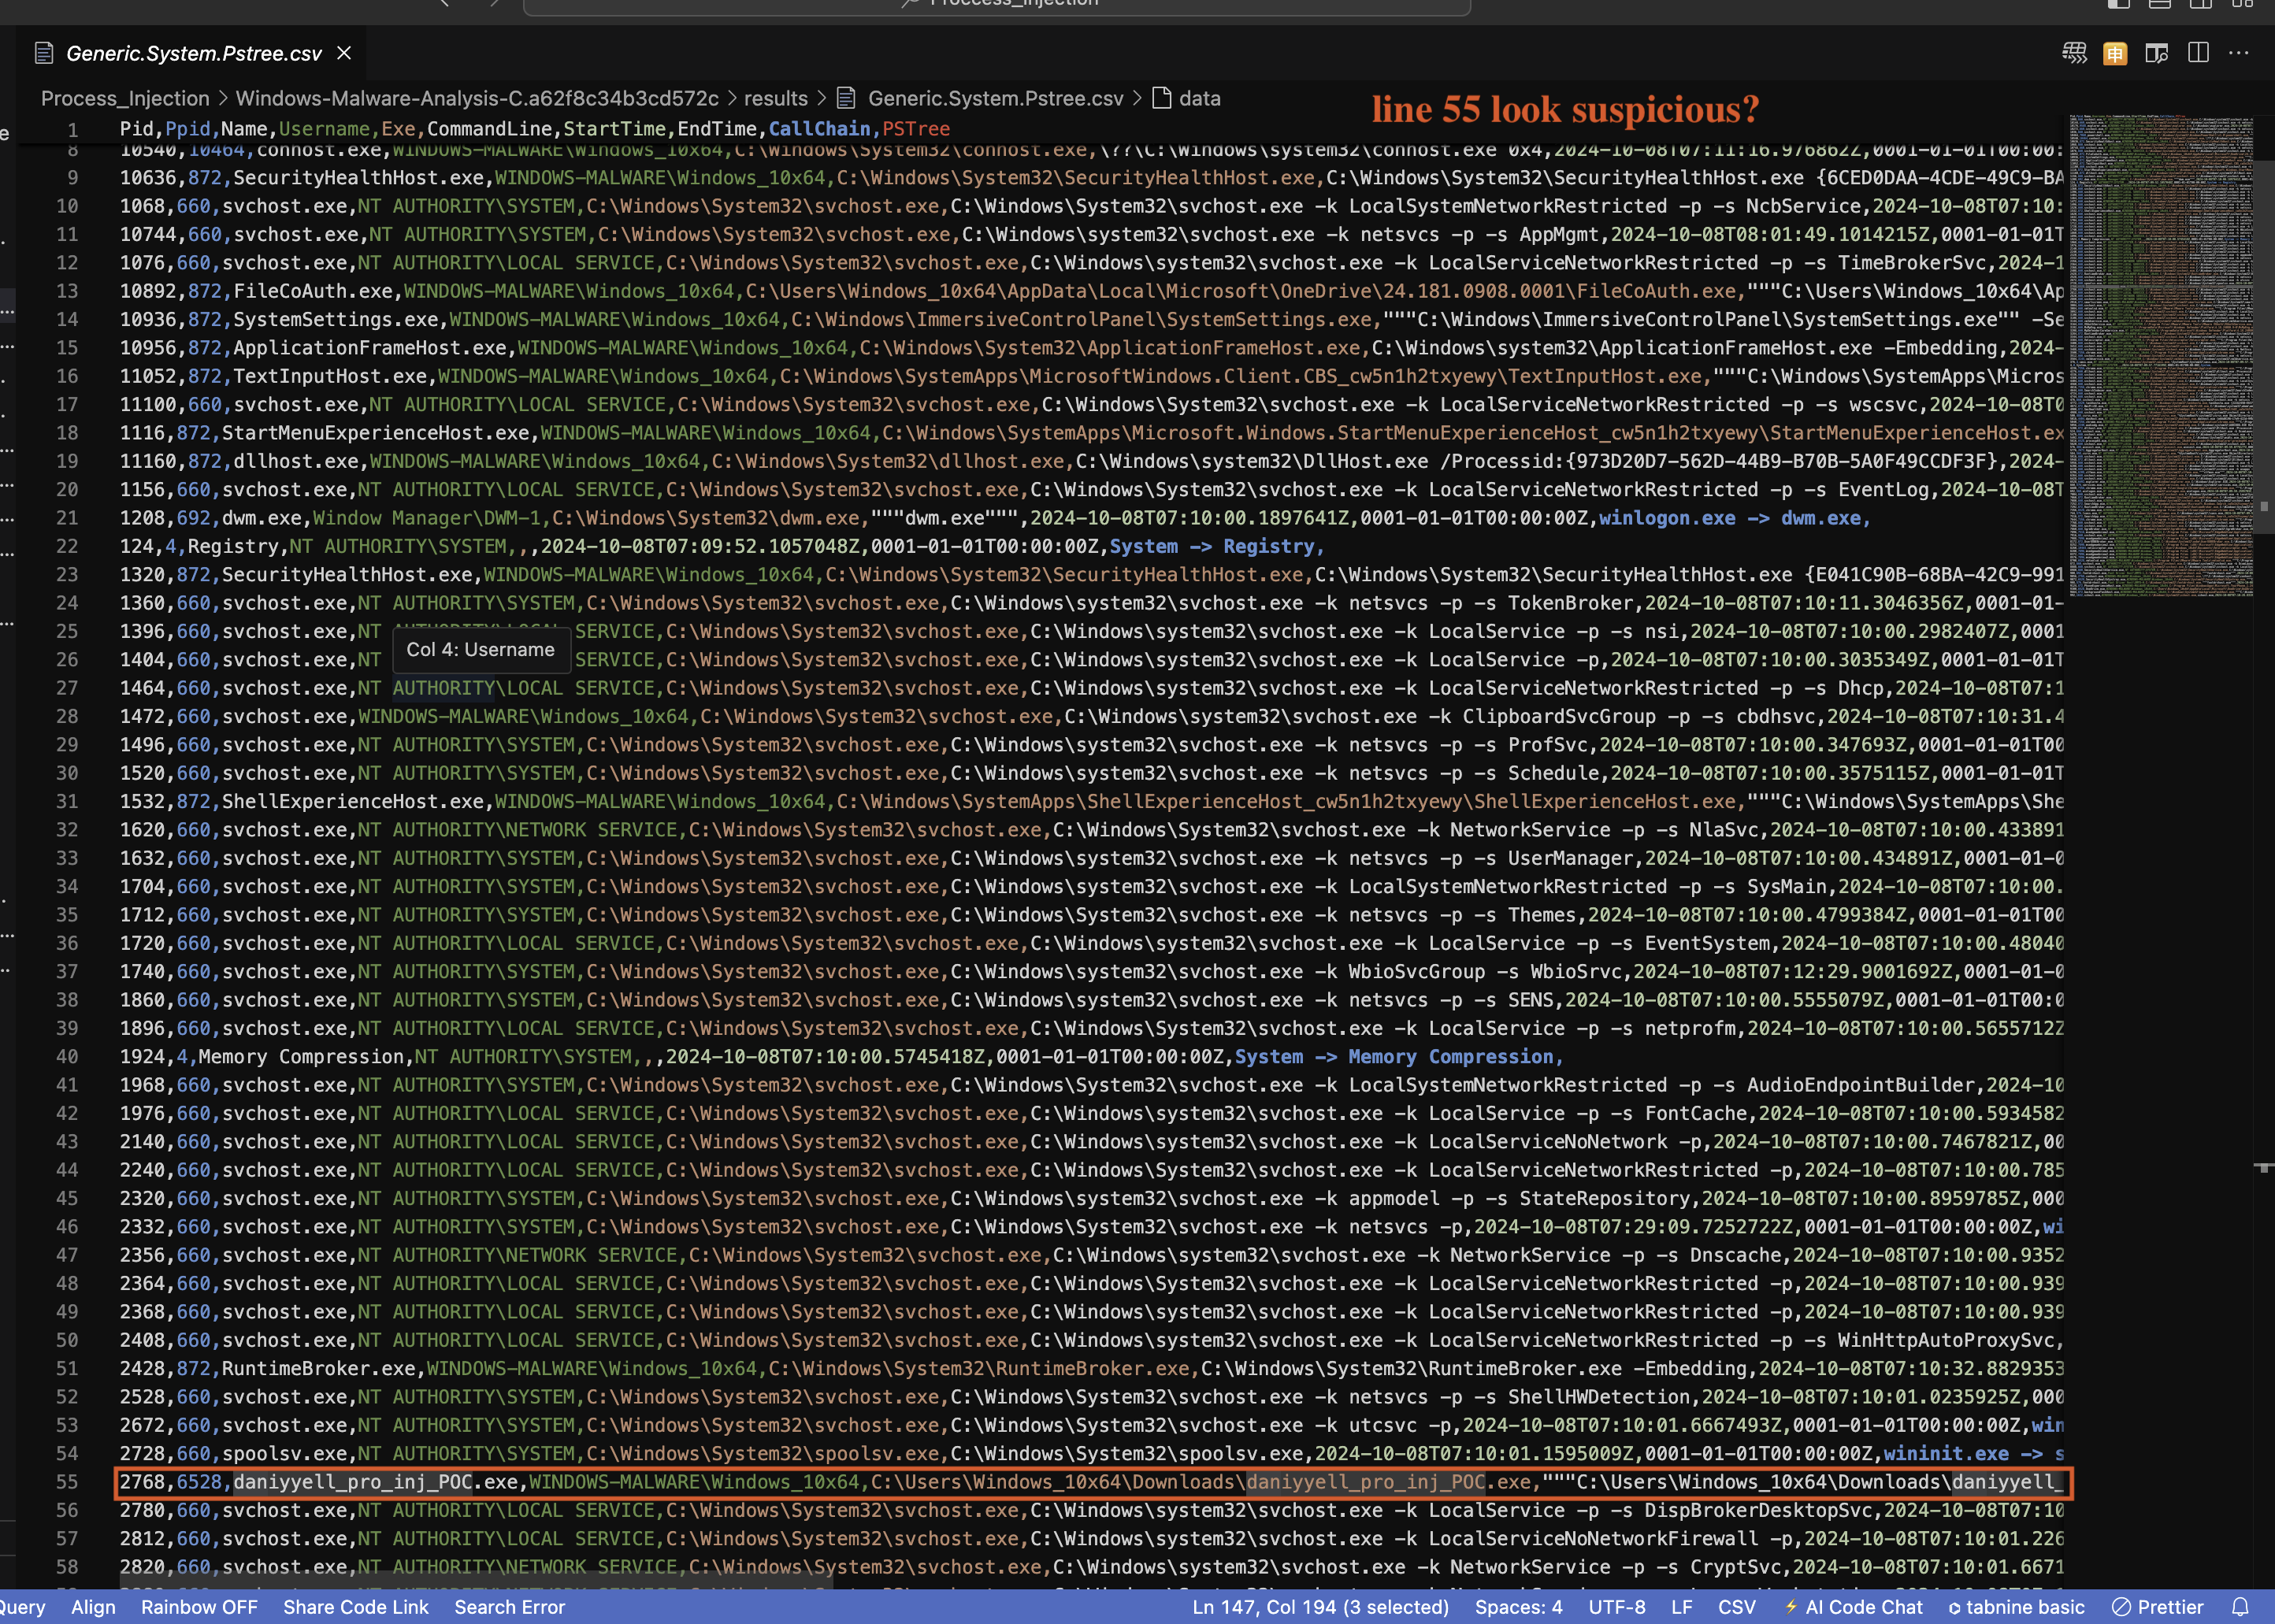
Fig 17: Generic.System.Pstree Results 1
2768,6528,daniyyell_pro_inj_POC.exe,WINDOWS-MALWARE\Windows_10x64,
C:\Users\Windows_10x64\Downloads\daniyyell_pro_inj_POC.exe,
"""C:\Users\Windows_10x64\Downloads\daniyyell_pro_inj_POC.exe""",
2024-10-08T08:02:00.3085034Z,0001-01-01T00:00:00Z,explorer.exe -> daniyyell_pro_inj_POC.exe
In this line, the process daniyyell_pro_inj_POC.exe is shown to have been launched by explorer.exe. The executable resides in the Downloads folder, which is often the location for files retrieved from the internet. This is already a red flag as legitimate executables typically run from system paths (e.g., C:\Windows\System32) or trusted program installation directories.
Furthermore, the timestamp (2024-10-08T08:02:00.3085034Z) aligns with the timeframe of malware execution. At this stage, however, we cannot make a definite verdict on whether this process is malicious based solely on its name and location. The parent-child relationship with explorer.exe also does not immediately indicate suspicious activity, as it is common for explorer.exe to spawn processes. However, the context begins to change as we move to line 147, which is shown in Fig 18.
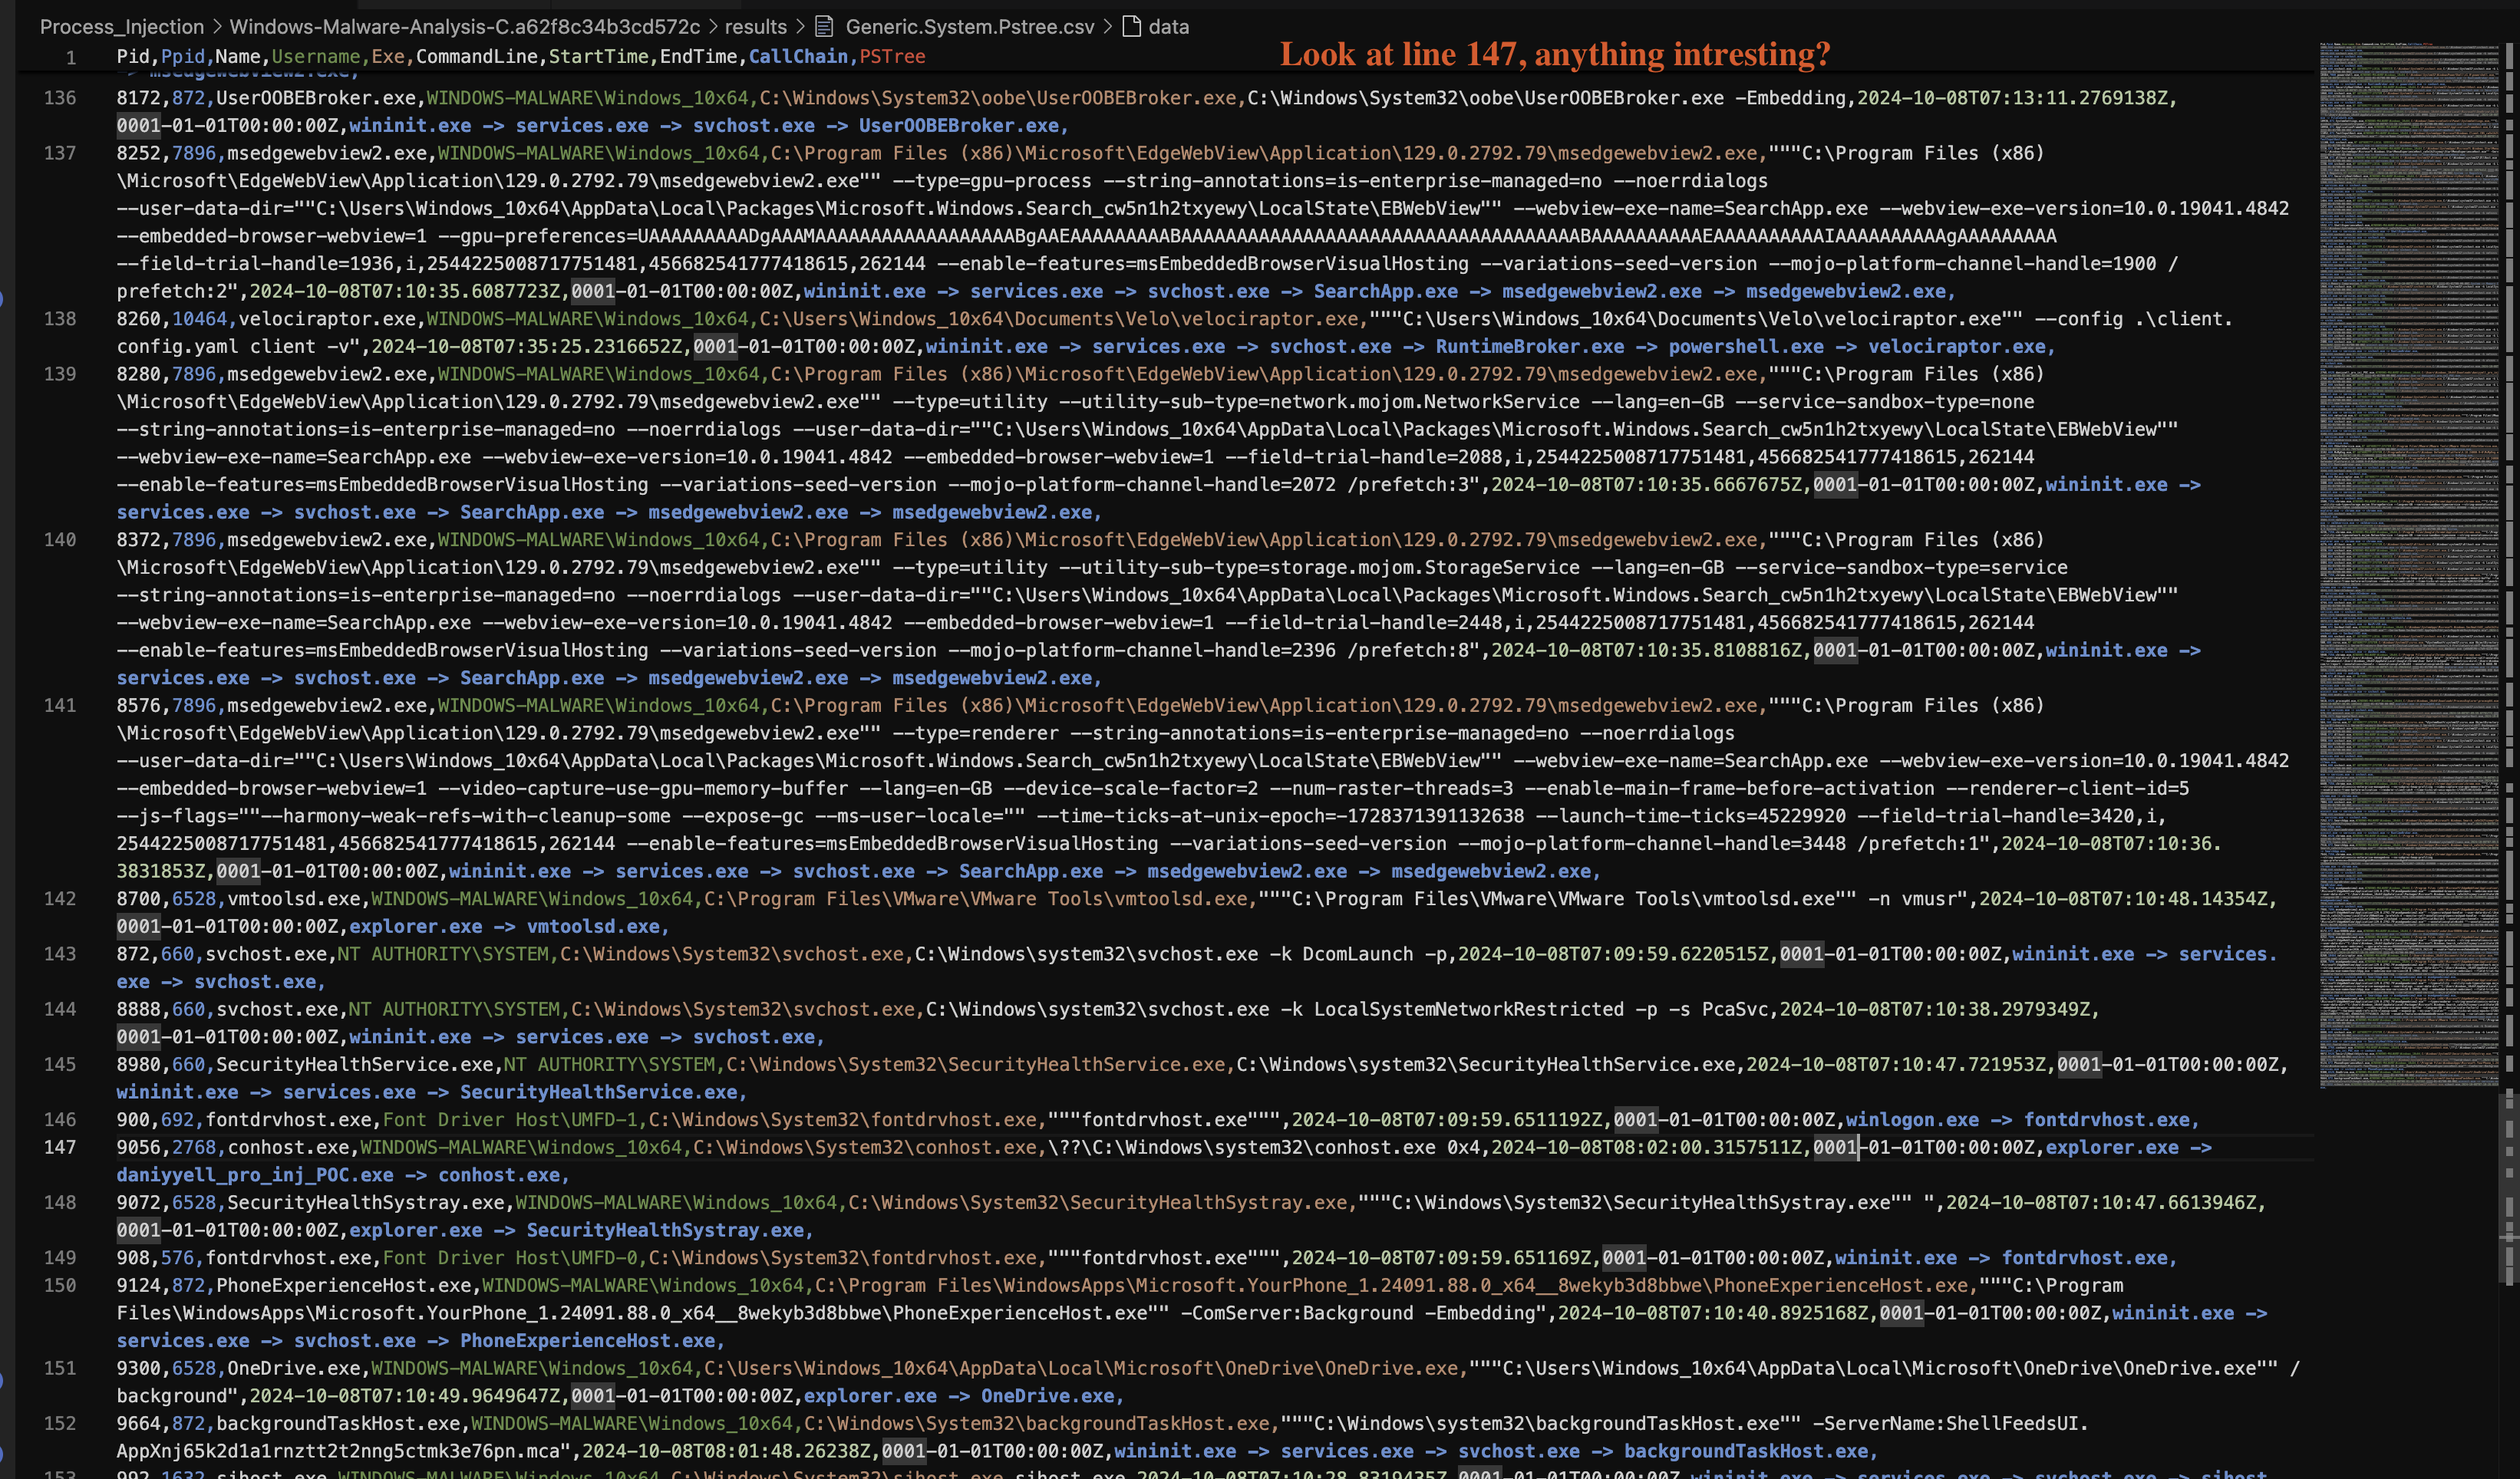
Fig 18: Generic.System.Pstree Results 2
9056,2768,conhost.exe,WINDOWS-MALWARE\Windows_10x64,
C:\Windows\System32\conhost.exe,\??\C:\Windows\system32\conhost.exe 0x4,
2024-10-08T08:02:00.3157511Z,0001-01-01T00:00:00Z,explorer.exe -> daniyyell_pro_inj_POC.exe -> conhost.exe
Here, we see that daniyyell_pro_inj_POC.exe has spawned conhost.exe. The Console Window Host (conhost.exe) is a legitimate Windows process responsible for console programs (such as the Command Prompt), but it can be leveraged by malware for stealthy activities, including process hollowing.
The execution chain now becomes more suspicious:
explorer.exelaunchesdaniyyell_pro_inj_POC.exe.daniyyell_pro_inj_POC.exesubsequently launchesconhost.exe.
Key Observations:
-
Suspicious Process Location:
The executabledaniyyell_pro_inj_POC.exeruns from the Downloads folder, which is a non-standard location for legitimate software. Files in this directory are typically downloaded from external sources, increasing the likelihood that they may be untrusted or malicious. -
Process Chain:
The relationship betweendaniyyell_pro_inj_POC.exeandconhost.exeraises significant concerns. Process injection techniques, such as process hollowing, are often observed when an attacker spawns a legitimate process (e.g.,conhost.exe) and injects malicious code into it. The fact thatdaniyyell_pro_inj_POC.exeis spawningconhost.exesuggests that this could be the beginning of such a technique. -
Timestamp Correlation:
Both processes are initiated at nearly the same time (within milliseconds of each other), which aligns with typical behaviour seen during malware execution. The rapid spawning of child processes is a common feature of malware attempting to hide its activity. -
Console Window Host Misuse:
The usage ofconhost.execan be particularly concerning because attackers often abuse this process to facilitate further malicious operations without alerting the user or security tools. Whileconhost.exeis a legitimate process, the context of its parent (daniyyell_pro_inj_POC.exe) significantly increases the likelihood that it is being misused in this case.
Semi-Conclusion 1
A semi-conclusion in this context means that we cannot definitively conclude that this is malware or a process hollowing instance just yet.
Based on the evidence gathered from the Generic.System.Pstree artefact, it is highly likely that daniyyell_pro_inj_POC.exe is malicious. The process chain and behaviour align with common process hollowing techniques, where a legitimate process like conhost.exe is used to mask malicious activity.
While we refrain from making definitive conclusions at this stage of the analysis, the artefacts clearly demonstrate the file’s progression through the system, starting from its execution by explorer.exe, followed by the spawning of a suspicious conhost.exe process. This analysis strongly suggests that daniyyell_pro_inj_POC.exe could be involved in malicious activity.
However, it is important to emphasise that we are only building a profile of the file we suspect. A final decision will be made after correlating other artefact results. At this stage, we can make a semi-conclusion that this file may or may not be malware.
From the Generic.System.Pstree artefact, we observed the following process chain:
explorer.exeinitiateddaniyyell_pro_inj_POC.exe.daniyyell_pro_inj_POC.exesubsequently spawnedconhost.exe.
2. Windows.Attack.Prefetch
The Windows.Attack.Prefetch artefact is crucial in understanding the execution patterns of the daniyyell_pro_inj_POC.exe file. The prefetch feature in Windows is designed to speed up the launch of applications by storing information about the executables that have been run, including their last execution times and the files they accessed. By analysing prefetch files, we can gain insights into the execution of potentially malicious applications as shown in Fig 19.
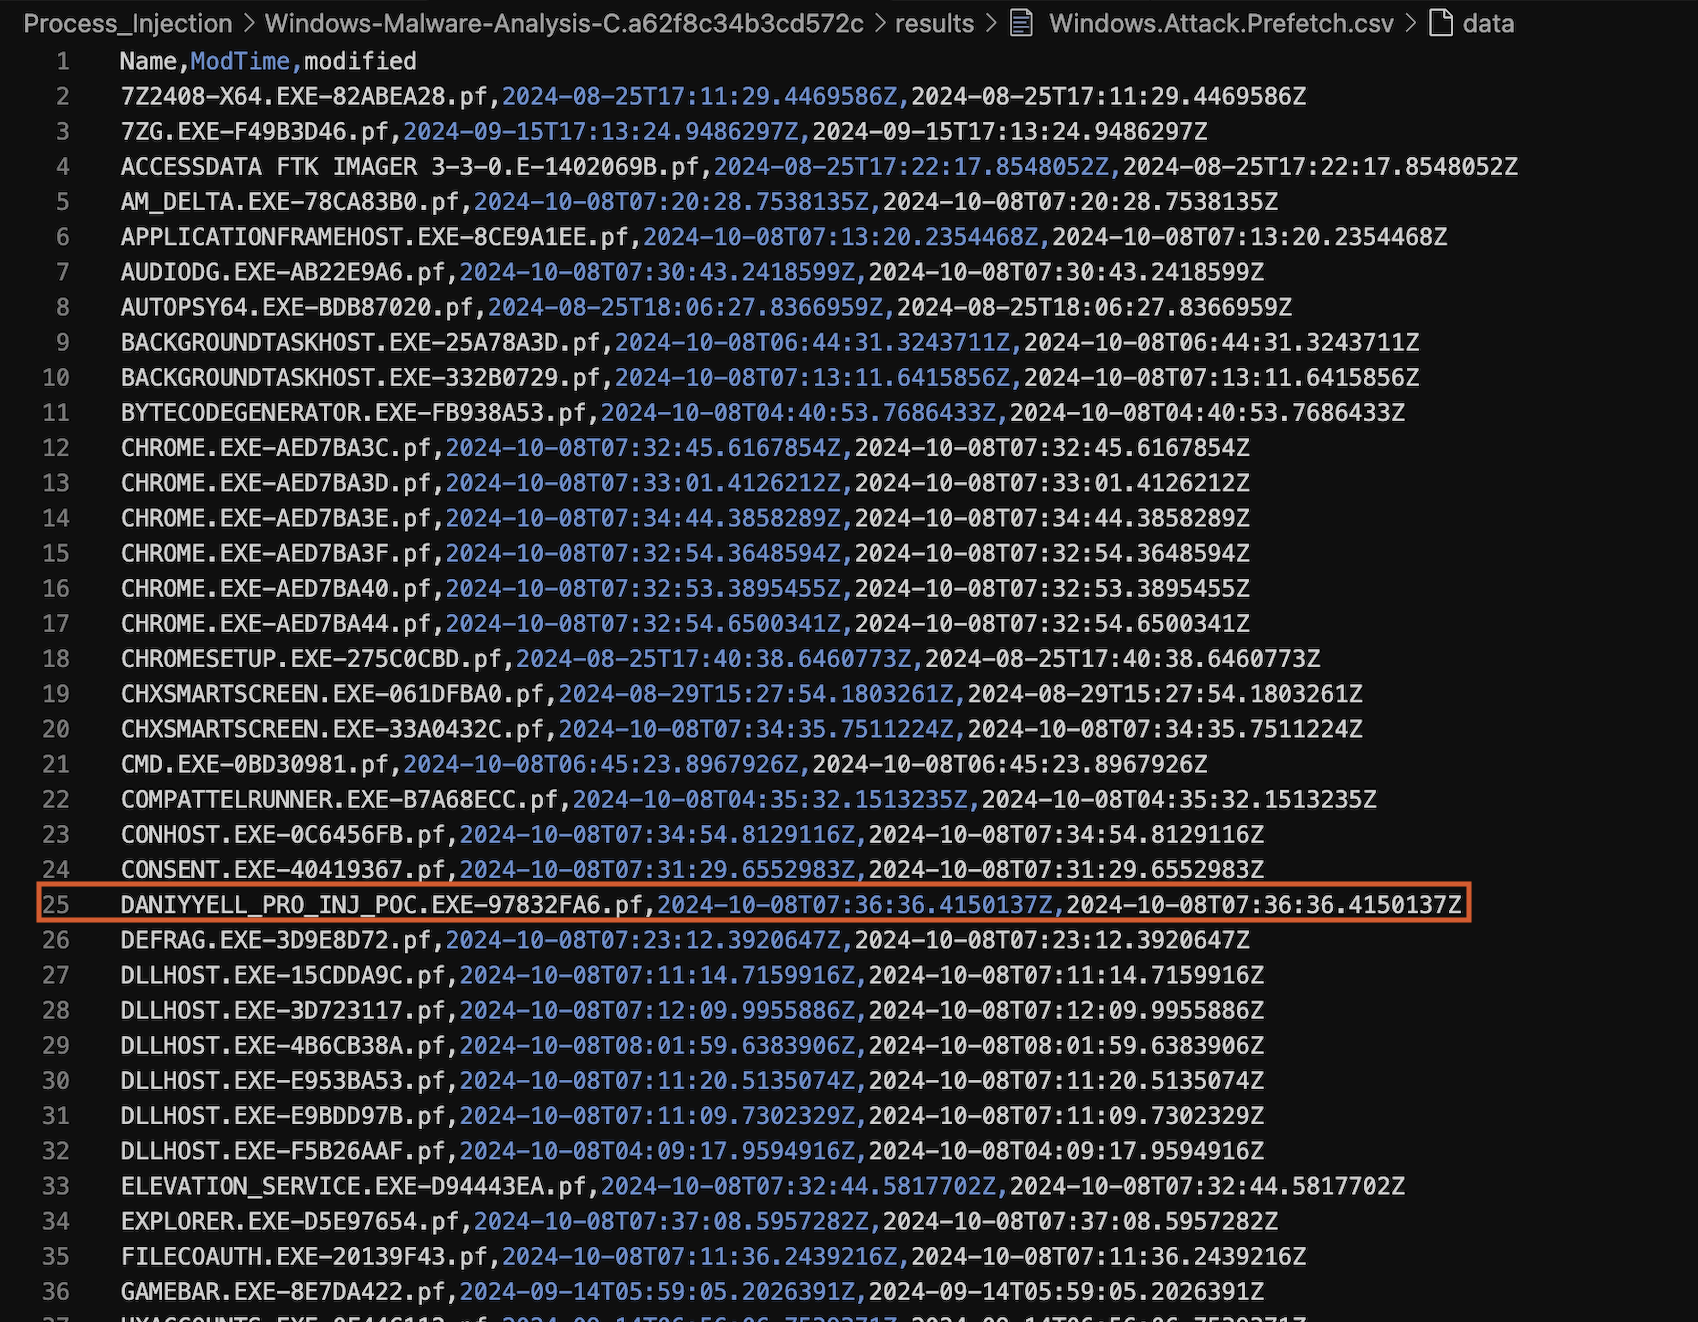
Fig 19: Windows.Attack.Prefetch Results
Analysis of the Prefetch File
The specific prefetch file in question is DANIYYELL_PRO_INJ_POC.EXE-97832FA6.pf, with a timestamp of 2024-10-08T07:36:36.4150137Z. This information provides several important details:
-
File Name and Hash: The prefetch file is associated with the executable
daniyyell_pro_inj_POC.exe, indicating that the system has executed this file. The hash97832FA6serves as a unique identifier for the execution instance, which can be cross-referenced with other artefacts to validate its presence and activity. -
Execution Timestamp: The timestamp shows when
daniyyell_pro_inj_POC.exewas last executed. This information is critical for correlating events in the timeline of a potential attack. In this case, the timestamp indicates that the executable was run shortly before the other artefacts we have examined, suggesting a cohesive timeline of malicious activity.
Key Observations
- Recent Execution: The execution of the
daniyyell_pro_inj_POC.exeat the given timestamp aligns with our previous findings from the Generic.System.Pstree artefact, reinforcing the idea that the file is actively being used in the system.
Semi Conclusion 2
The presence of the DANIYYELL_PRO_INJ_POC.EXE-97832FA6.pf prefetch file reinforces our suspicion of the file’s malicious nature. It indicates that the executable was run on the system, and when analysed in conjunction with other artefacts, it provides further evidence of potentially harmful activity.
We will correlate this prefetch data with the Windows.Memory.ProcessInfo and Windows.System.Pslist artefacts for further verification. This approach will help us confirm whether daniyyell_pro_inj_POC.exe is malicious and identify which process is involved in the hollowing technique.
3. Windows.Memory.ProcessInfo
In Fig 20, we can observe the entry for daniyyell_pro_inj_POC.exe:
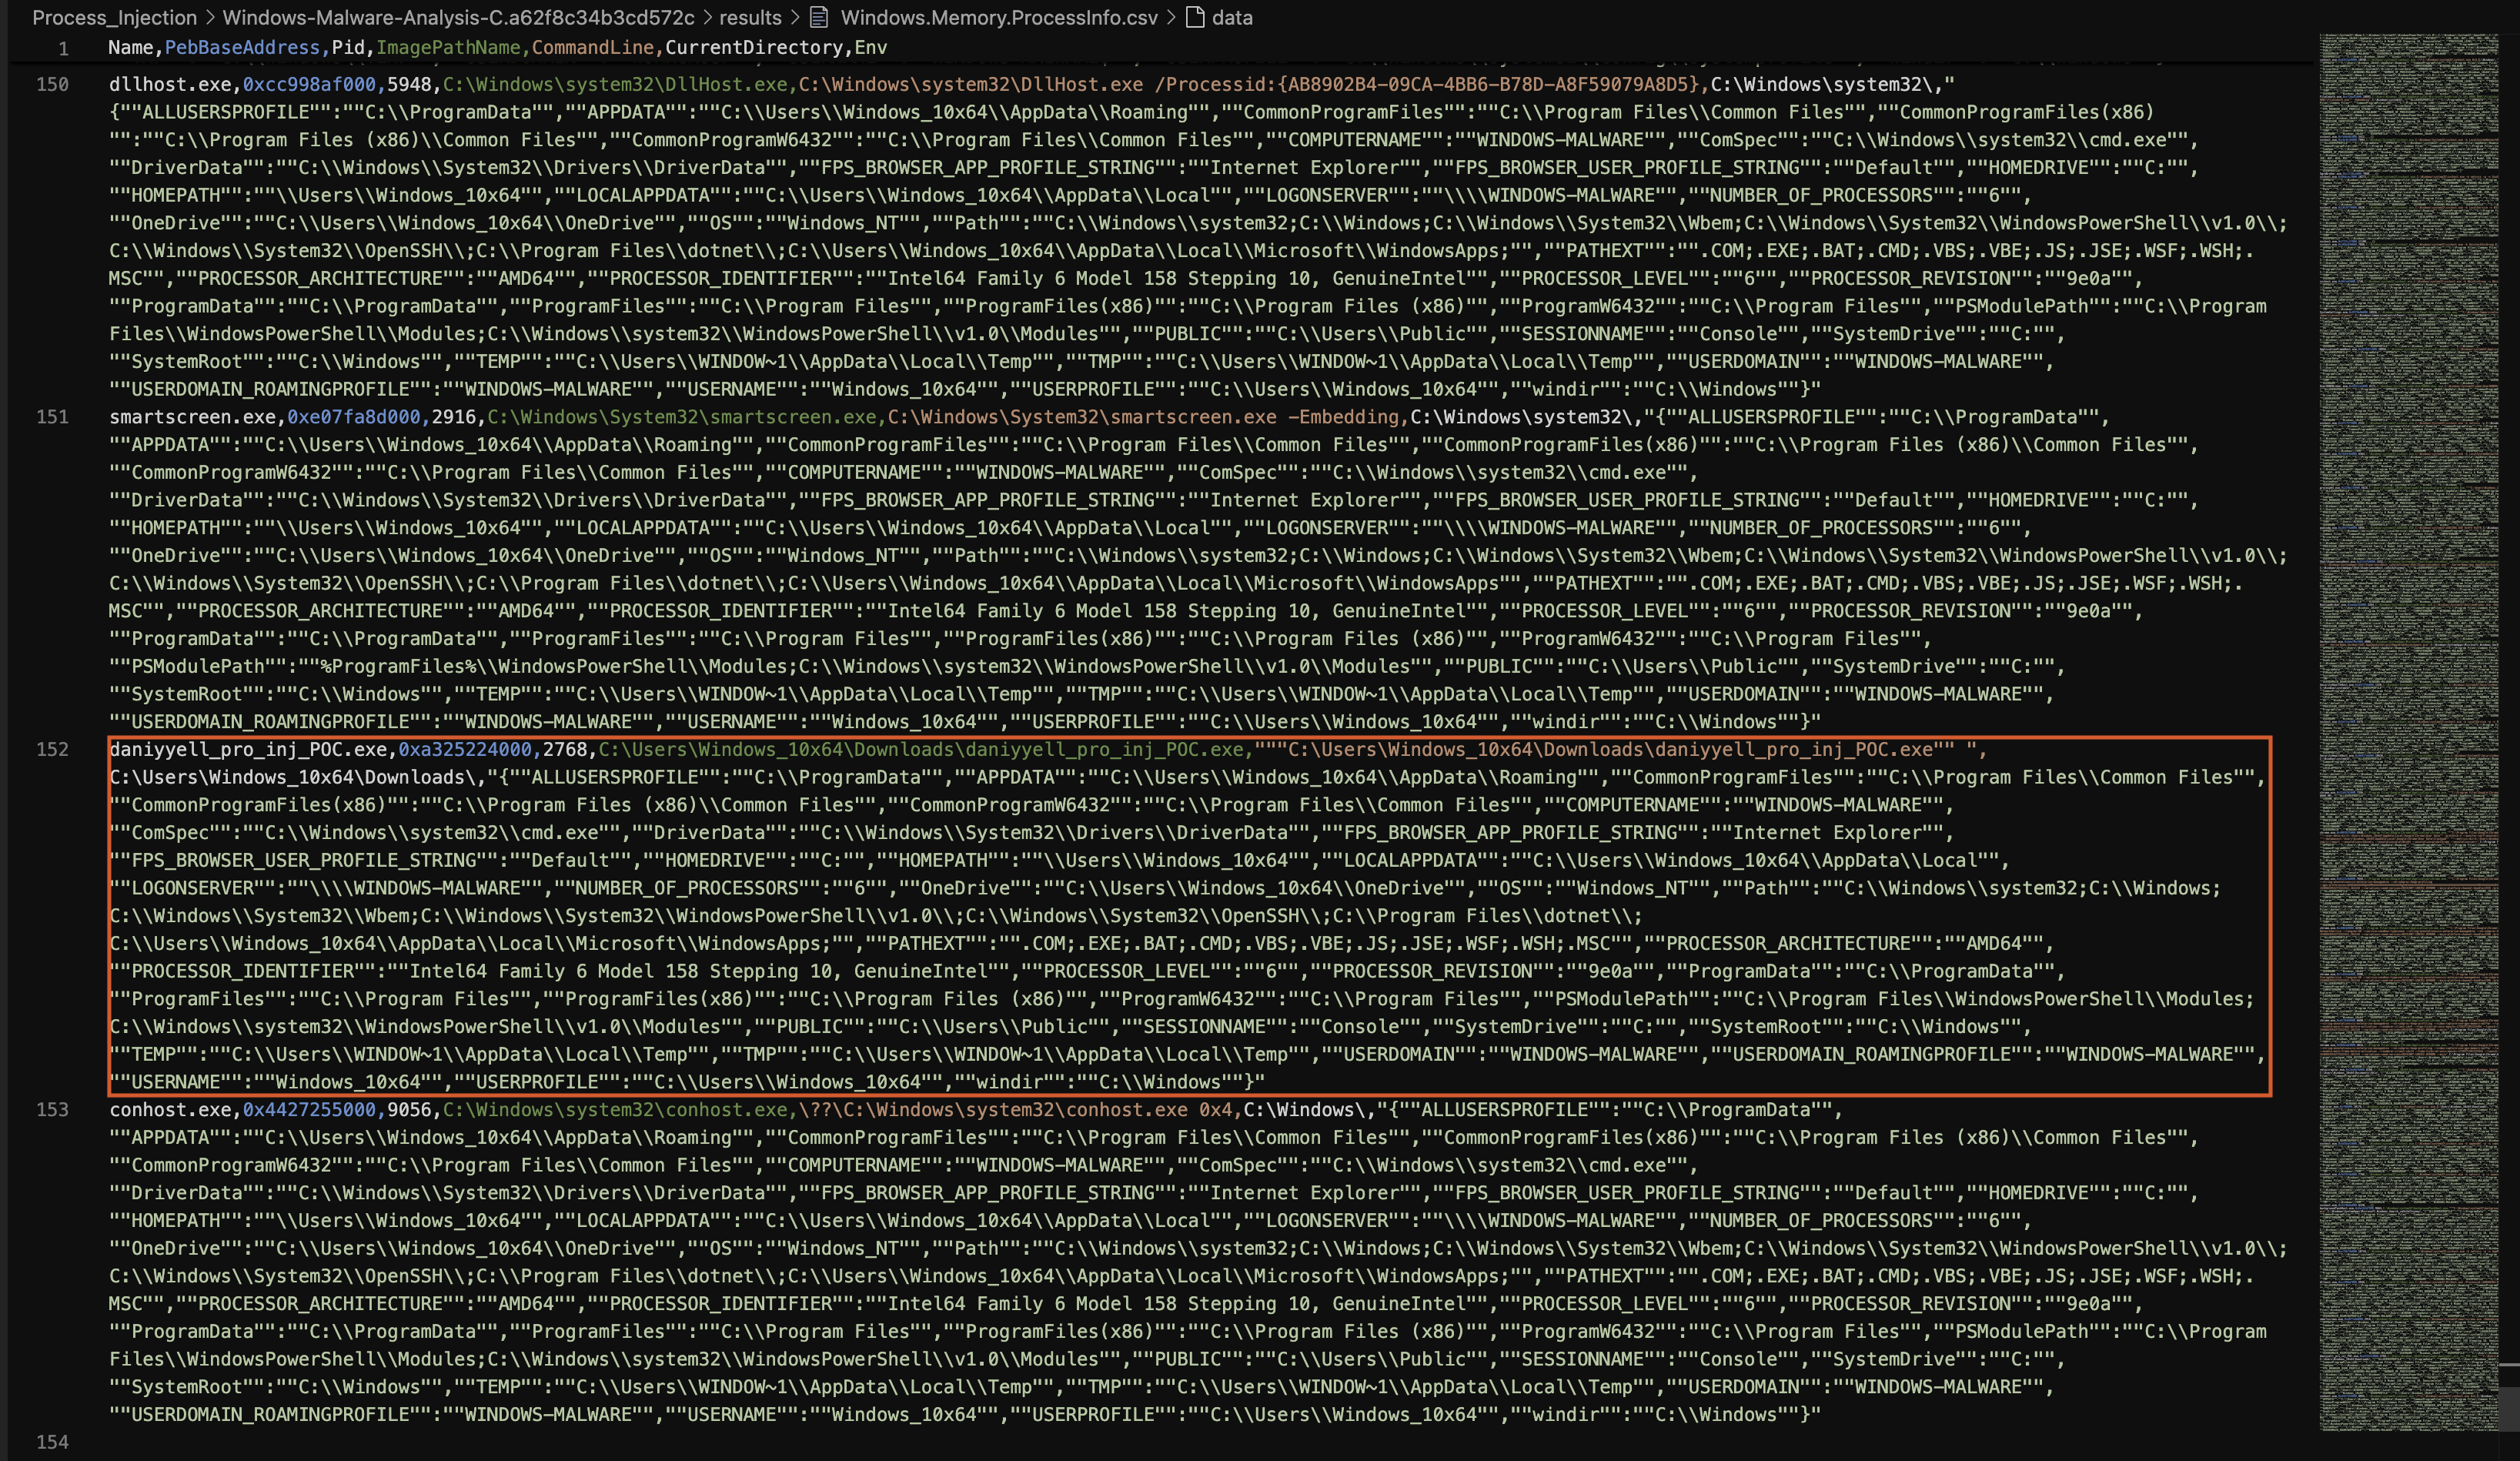
Fig 20: Windows.Memory.ProcessInfo Result
The details for daniyyell_pro_inj_POC.exe are as follows:
- Process Name:
daniyyell_pro_inj_POC.exe - Memory Address:
0xa325224000 - Process ID:
2768 - File Path:
C:\Users\Windows_10x64\Downloads\daniyyell_pro_inj_POC.exe - Command Line:
"""C:\Users\Windows_10x64\Downloads\daniyyell_pro_inj_POC.exe"" - Working Directory:
C:\Users\Windows_10x64\Downloads\ - Environment Variables: The entry also includes various environment variables, indicating the configuration of the system at the time the process was running.
Analysis
The information presented in the Windows.Memory.ProcessInfo artefact gives insight into the operational context of daniyyell_pro_inj_POC.exe.
-
File Path and Origin: The executable resides in the Downloads folder, which is typically associated with files downloaded from the internet. This is a common location for potentially malicious files, as users often download software without verifying its authenticity.
-
Process ID and Memory Address: The presence of a unique process ID (2768) and memory address (0xa325224000) suggests that the process is actively running in memory. Monitoring these details can help track the behaviour of the executable and its interactions with other system components.
-
Command Line Arguments: The command line shows that the executable was invoked directly without any additional parameters, which is typical for malicious executables as they often run with minimal user interaction or prompts.
-
Environment Variables: The comprehensive list of environment variables reveals the system’s configuration. Notably, it includes paths for system directories, user profile information, and other system properties. This information can be valuable for understanding how the malware might interact with the system. For instance, the
USERPROFILEvariable indicates that the malware is operating under theWindows_10x64user account.
Semi Conclusion 3
The information from the Windows.Memory.ProcessInfo artefact supports the suspicion surrounding daniyyell_pro_inj_POC.exe. Its presence in the Downloads folder, the command line used to execute it, and its active memory allocation suggest potential malicious activity. We will conduct the final analysis using Windows.System.Pslist. This will help us draw our final conclusions and, hopefully, identify any processes that daniyyell_pro_inj_POC.exe is using apart from conhost.exe.
4. Windows.System.Pslist
The Windows.System.Pslist artefact provides valuable insight into the processes running on the system, including crucial information regarding the process in question, daniyyell_pro_inj_POC.exe. As illustrated in Figure 21, which is shown in line 152, this artefact details the process’s execution and environment.
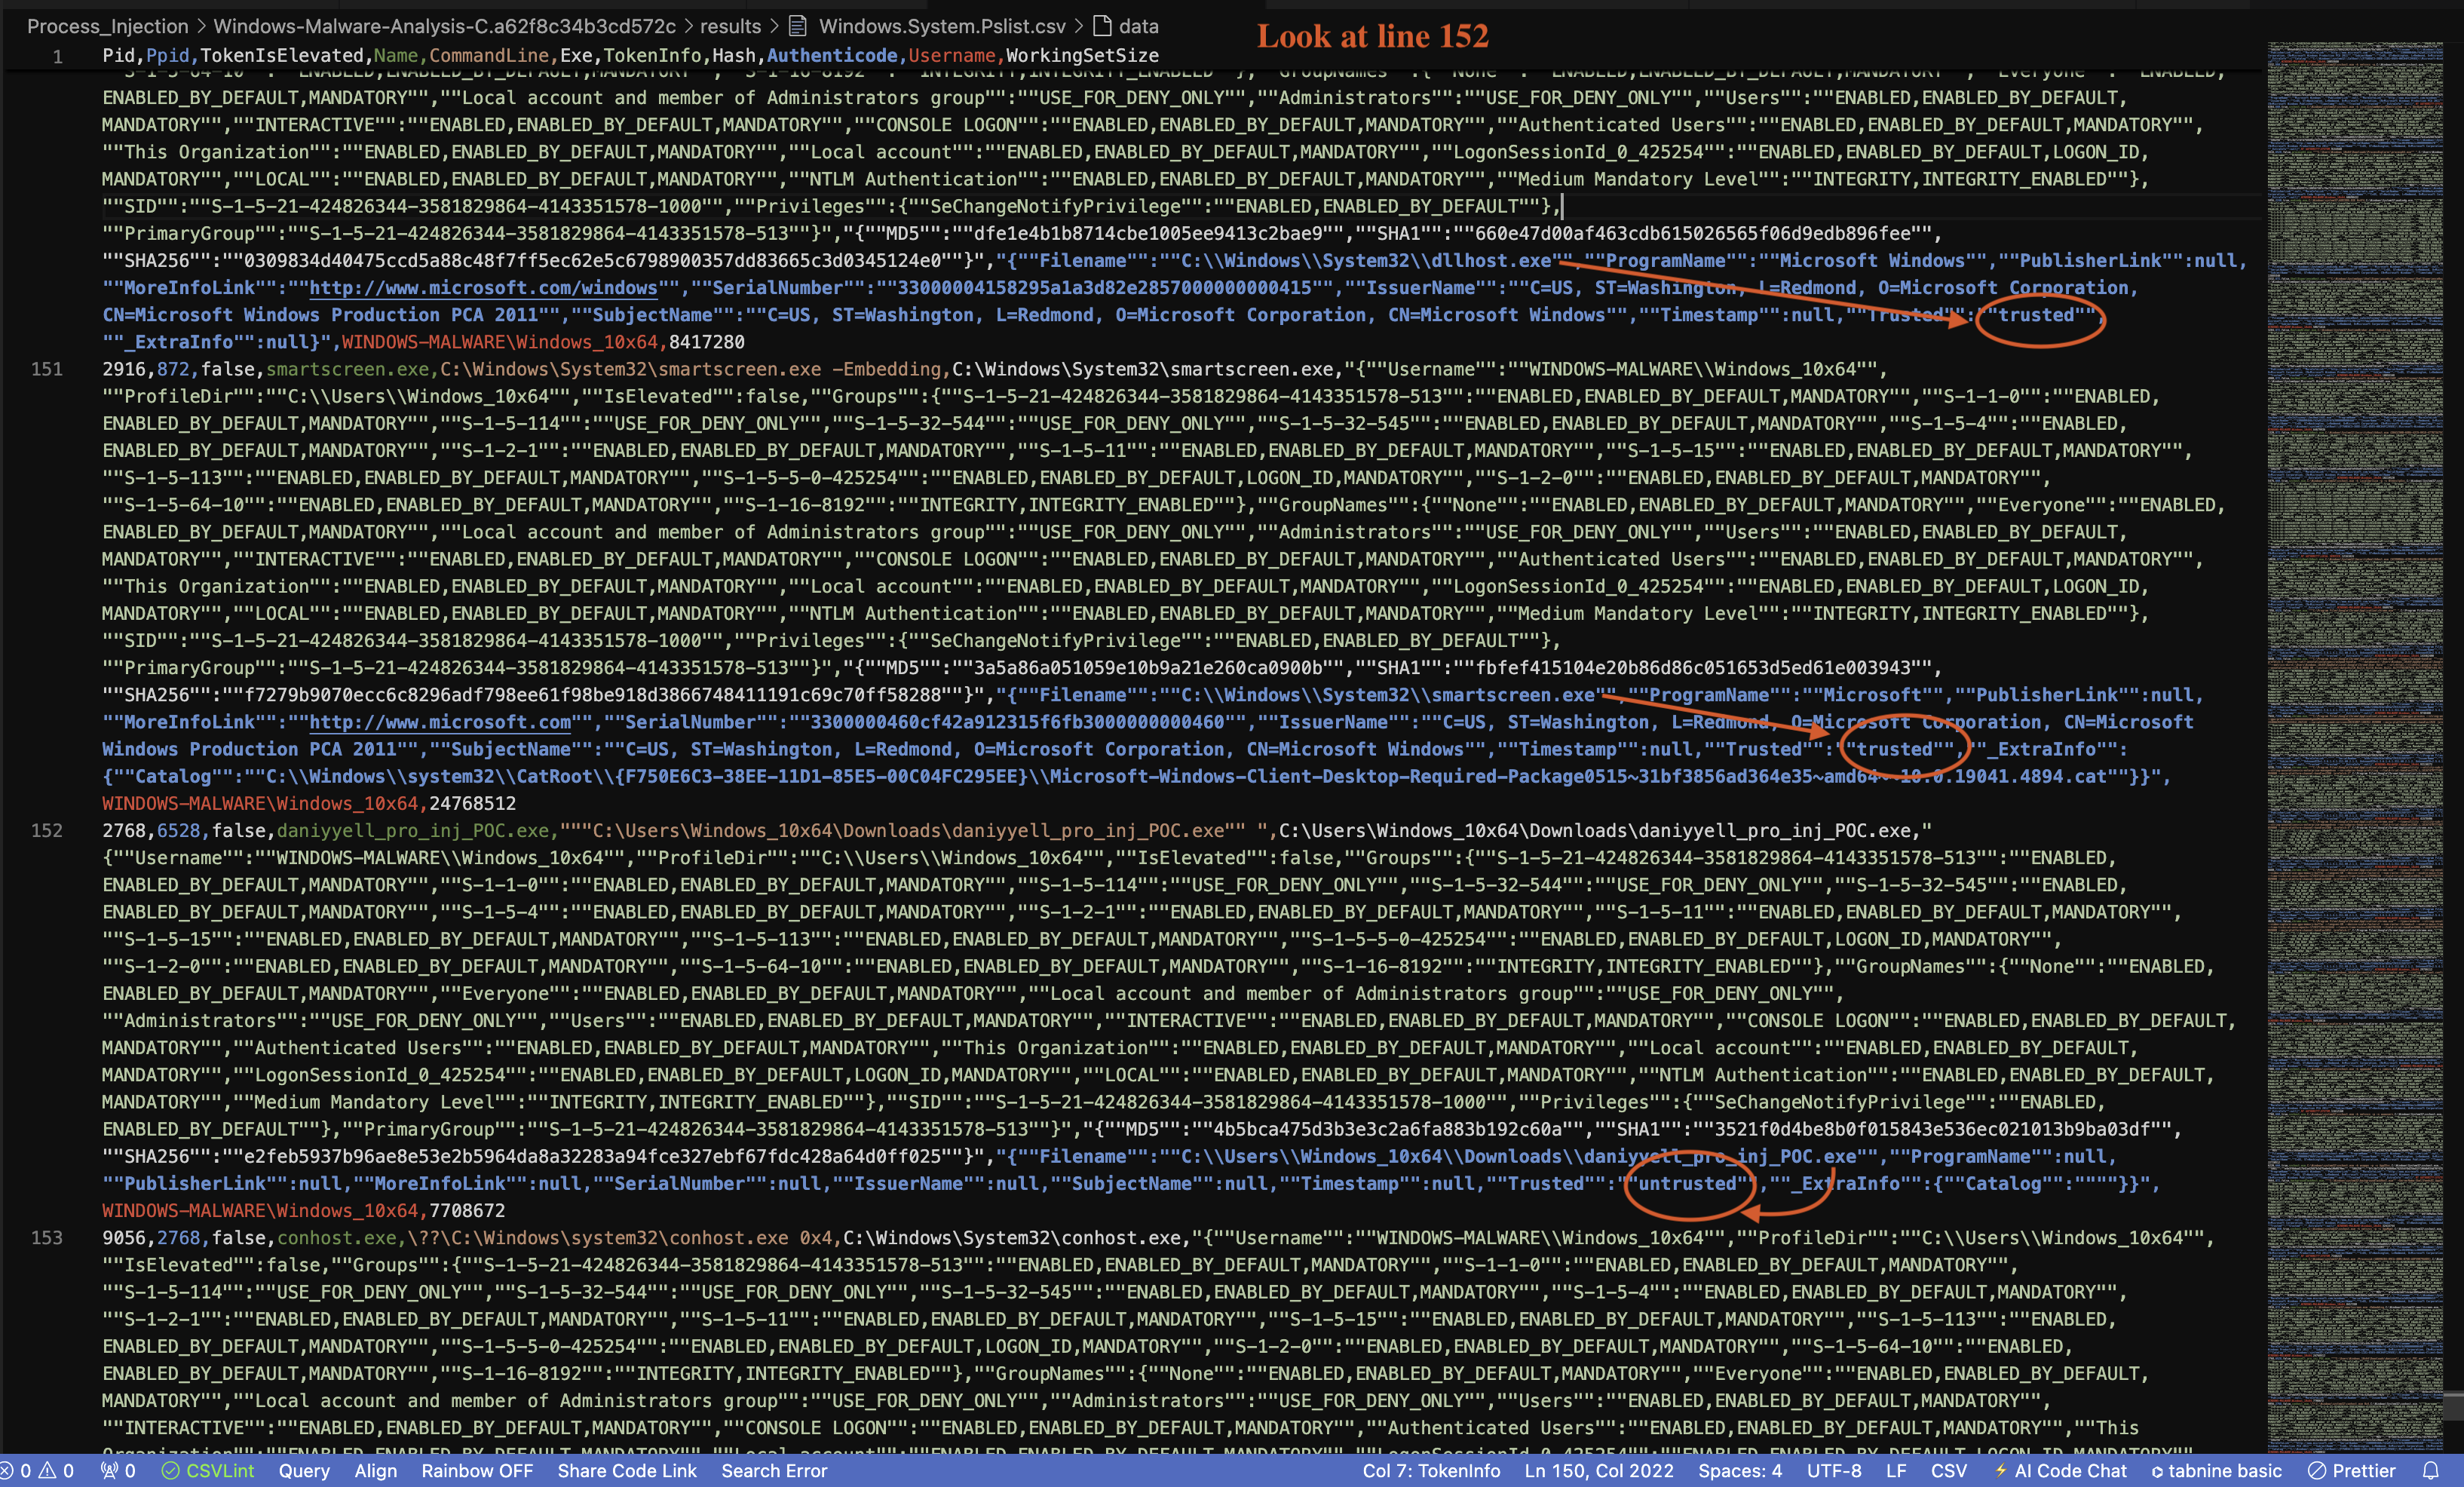
Fig 21: Windows.System.Pslist Result
The entry for daniyyell_pro_inj_POC.exe indicates several key attributes:
- Process ID (PID): 2768
- Parent Process ID (PPID): 6528
- File Path:
C:\Users\Windows_10x64\Downloads\daniyyell_pro_inj_POC.exe - User:
WINDOWS-MALWARE\Windows_10x64 - Trusted Status: Untrusted
- Hash Values: MD5, SHA1, and SHA256, which can be used to further identify and validate the executable.
Analysis
The Pslist output reveals that the daniyyell_pro_inj_POC.exe process is running under a user account that appears to be named after the system’s hostname, WINDOWS-MALWARE. This unusual naming convention is deliberate for this lab.
The untrusted status of the executable strongly indicates that it may not have been verified by the operating system, further enhancing the suspicion surrounding its intent. Additionally, the process’s location in the Downloads directory is a common behaviour for potentially malicious files, as attackers often exploit users’ downloading habits.
Final Conclusion 1,2 and 3.
Correlation with Other Artefacts: Final Verdict
The analysis of the artefacts reveals significant insights into the behaviour of the executable daniyyell_pro_inj_POC.exe. The correlation between various data points highlights a strong likelihood that this executable is engaged in process hollowing, masquerading as legitimate Windows processes, specifically conhost.exe and explorer.exe.
Findings Overview:
-
Process Tree Analysis: The
Generic.System.Pstreeartefact shows a clear relationship whereexplorer.exeinitiatesdaniyyell_pro_inj_POC.exe, indicating that the executable may be attempting to blend in with legitimate system activity. -
Prefetch Information: The
Windows.Attack.Prefetchfile,DANIYYELL_PRO_INJ_POC.EXE-97832FA6.pf, has a timestamp suggesting it was executed shortly before the analysis, further confirming its recent activity and potential use in a malicious context. -
Process Information: The
Windows.Memory.ProcessInfoartefact confirms the execution ofdaniyyell_pro_inj_POC.exefrom theDownloadsdirectory, reinforcing the idea that this executable is not running in a typical application context, as seen in the path and process information. -
Process List Details: The
Windows.System.Pslistartefact indicates thatdaniyyell_pro_inj_POC.exeis not elevated, which may suggest it is trying to avoid detection by operating under the privileges of a normal user, enhancing its chances of executing malicious payloads without raising suspicion.
In conclusion, the analysis supports the assertion that daniyyell_pro_inj_POC.exe is leveraging process hollowing techniques to masquerade as legitimate processes such as conhost.exe and explorer.exe. This correlation across multiple artefacts underscores the importance of thorough investigation in identifying and mitigating potential threats in system behaviour.
Proof of Concepts
Cybersecurity is a challenging field, as evidenced by the complexities we often encounter in social media today. Validating findings can sometimes require extensive analysis, spanning weeks, months, or even years. In this context, it is essential to substantiate our discoveries using Velociraptor, either through its GUI method or by providing screenshots that clearly demonstrate the legitimacy of our findings.
In Fig 22, we can clearly see that our discoveries with Velociraptor are legitimate. We have effectively used Velociraptor to identify that daniyyell_pro_inj_POC.exe is indeed engaging in process hollowing, with both conhost.exe and explorer.exe being spawned by daniyyell_pro_inj_POC.exe. This allows us to draw conclusions about what is real or fake based on the key findings from Velociraptor.
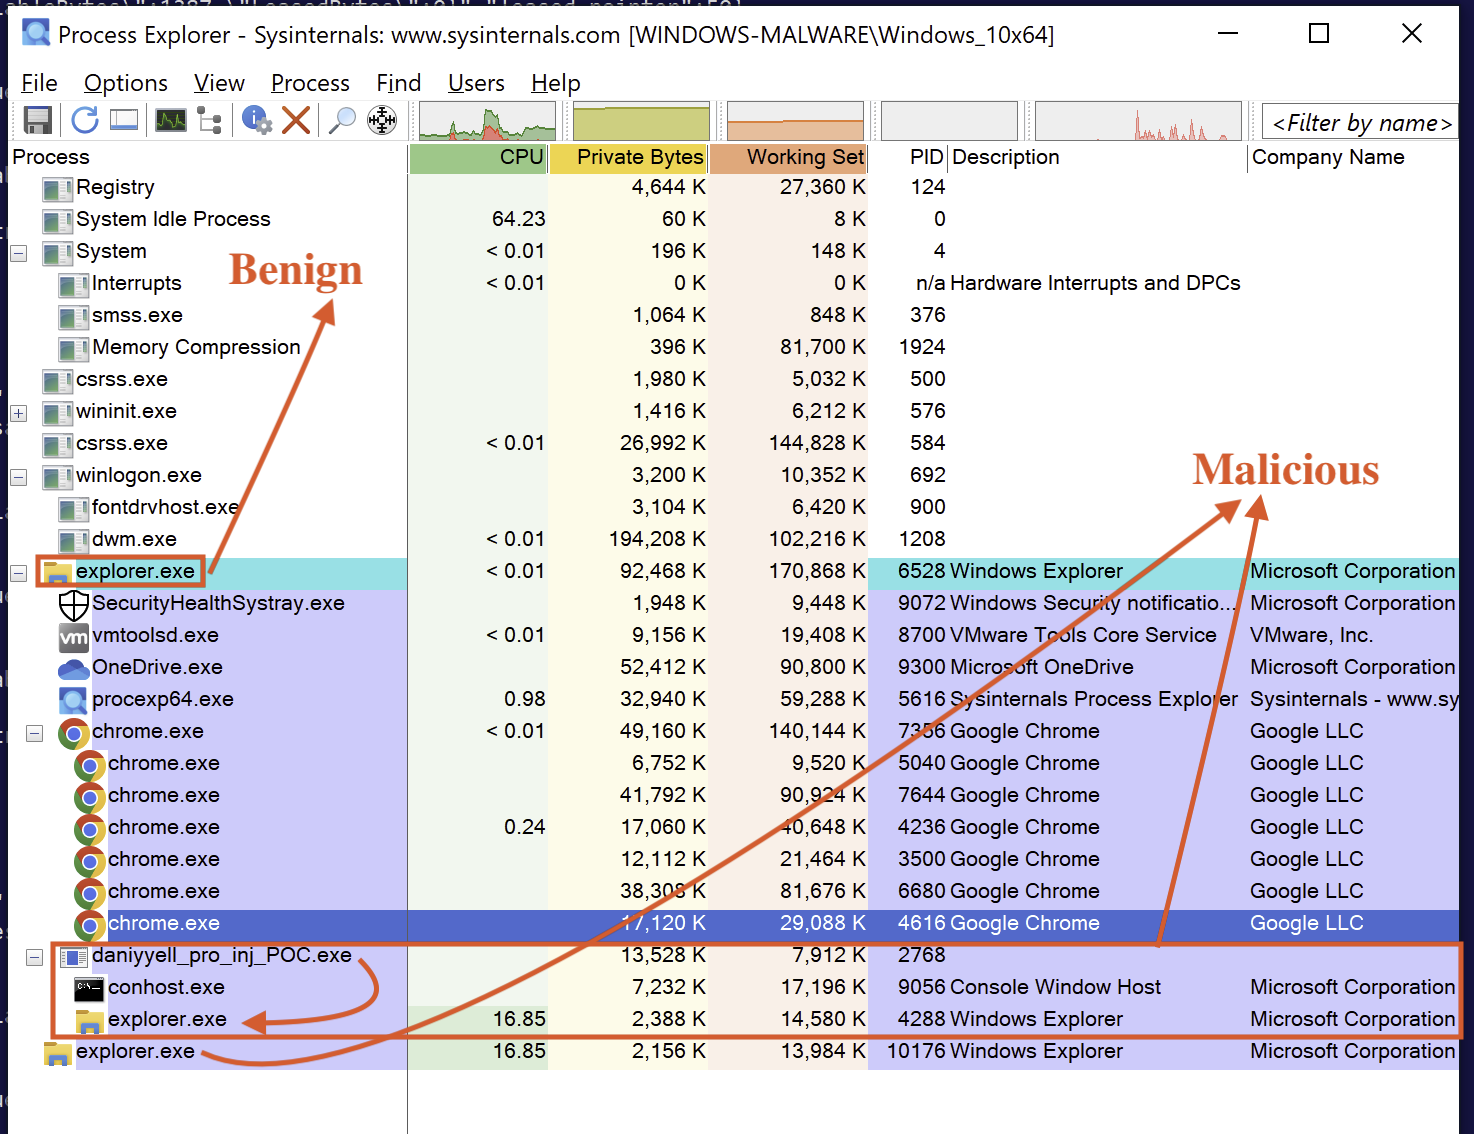
Fig 22: Analysing the Process
Although conhost.exe and explorer.exe may seem like legitimate Microsoft binaries, the results from Windows.System.Pslist indicate that daniyyell_pro_inj_POC.exe is not trusted. This evidence reinforces our confidence that the child processes associated with this file are indeed malicious.
Comparative Analysis of Explorer Instances
This phase analyses two instances of explorer.exe, one potentially malicious and the other benign as depited in Fig 23 and Table 1.
Similarities and Differences
| Feature | Malicious Explorer | Benign Explorer |
|---|---|---|
| Image File | explorer.exe | Windows Explorer |
| Version | 10.0.19041.4842 | 10.0.19041.4842 |
| Build Time | 10.0.19041.4842 | 10.0.19041.4842 |
| Command Line | C:\Windows\explorer.exe | C:\Windows\Explorer.EXE |
| Current Directory | C:\Users\Windows_1Uxb4\Downloads\ | C:\Windows\System32\ |
| Autostart Location | HKLM\SOFTWARE\Microsoft\Windows NT\CurrentVersion\Winlogon\Shell | HKLM\SOFTWARE\Microsoft\Windows NT\CurrentVersion\Winlogon\Shell |
| Parent Process | daniyyell_pro_inj_POC.exe (4764) | |
| User | WINDOWS-MALWARE\Windows_10x64 | WINDOWS-MALWARE\Windows_10x64 |
| Started | 07:14:53 08/10/2024 | 04:52:52 08/10/2024 |
| Image Architecture | 64-bit | 64-bit |
| Data Execution Prevention (DEP) Status | Enabled (permanent) | Enabled (permanent) |
| Address Space Layout Randomization (ASLR) | Bottom-Up | Bottom-Up |
| Control Flow Guard | Enabled | Enabled |
| Enterprise Context | N/A | N/A |
| Stack Protection | Disabled | Disabled |
Table 1: Comparative Analysis of Explorer Instances
Summary
The analysis reveals that both instances of explorer.exe share the same version and build time, indicating they originate from the same source. Both processes have enabled Data Execution Prevention (DEP) and Address Space Layout Randomization (ASLR), suggesting a level of standard security measures. However, the malicious instance has a different command line, current directory, and parent process, which raises suspicion.
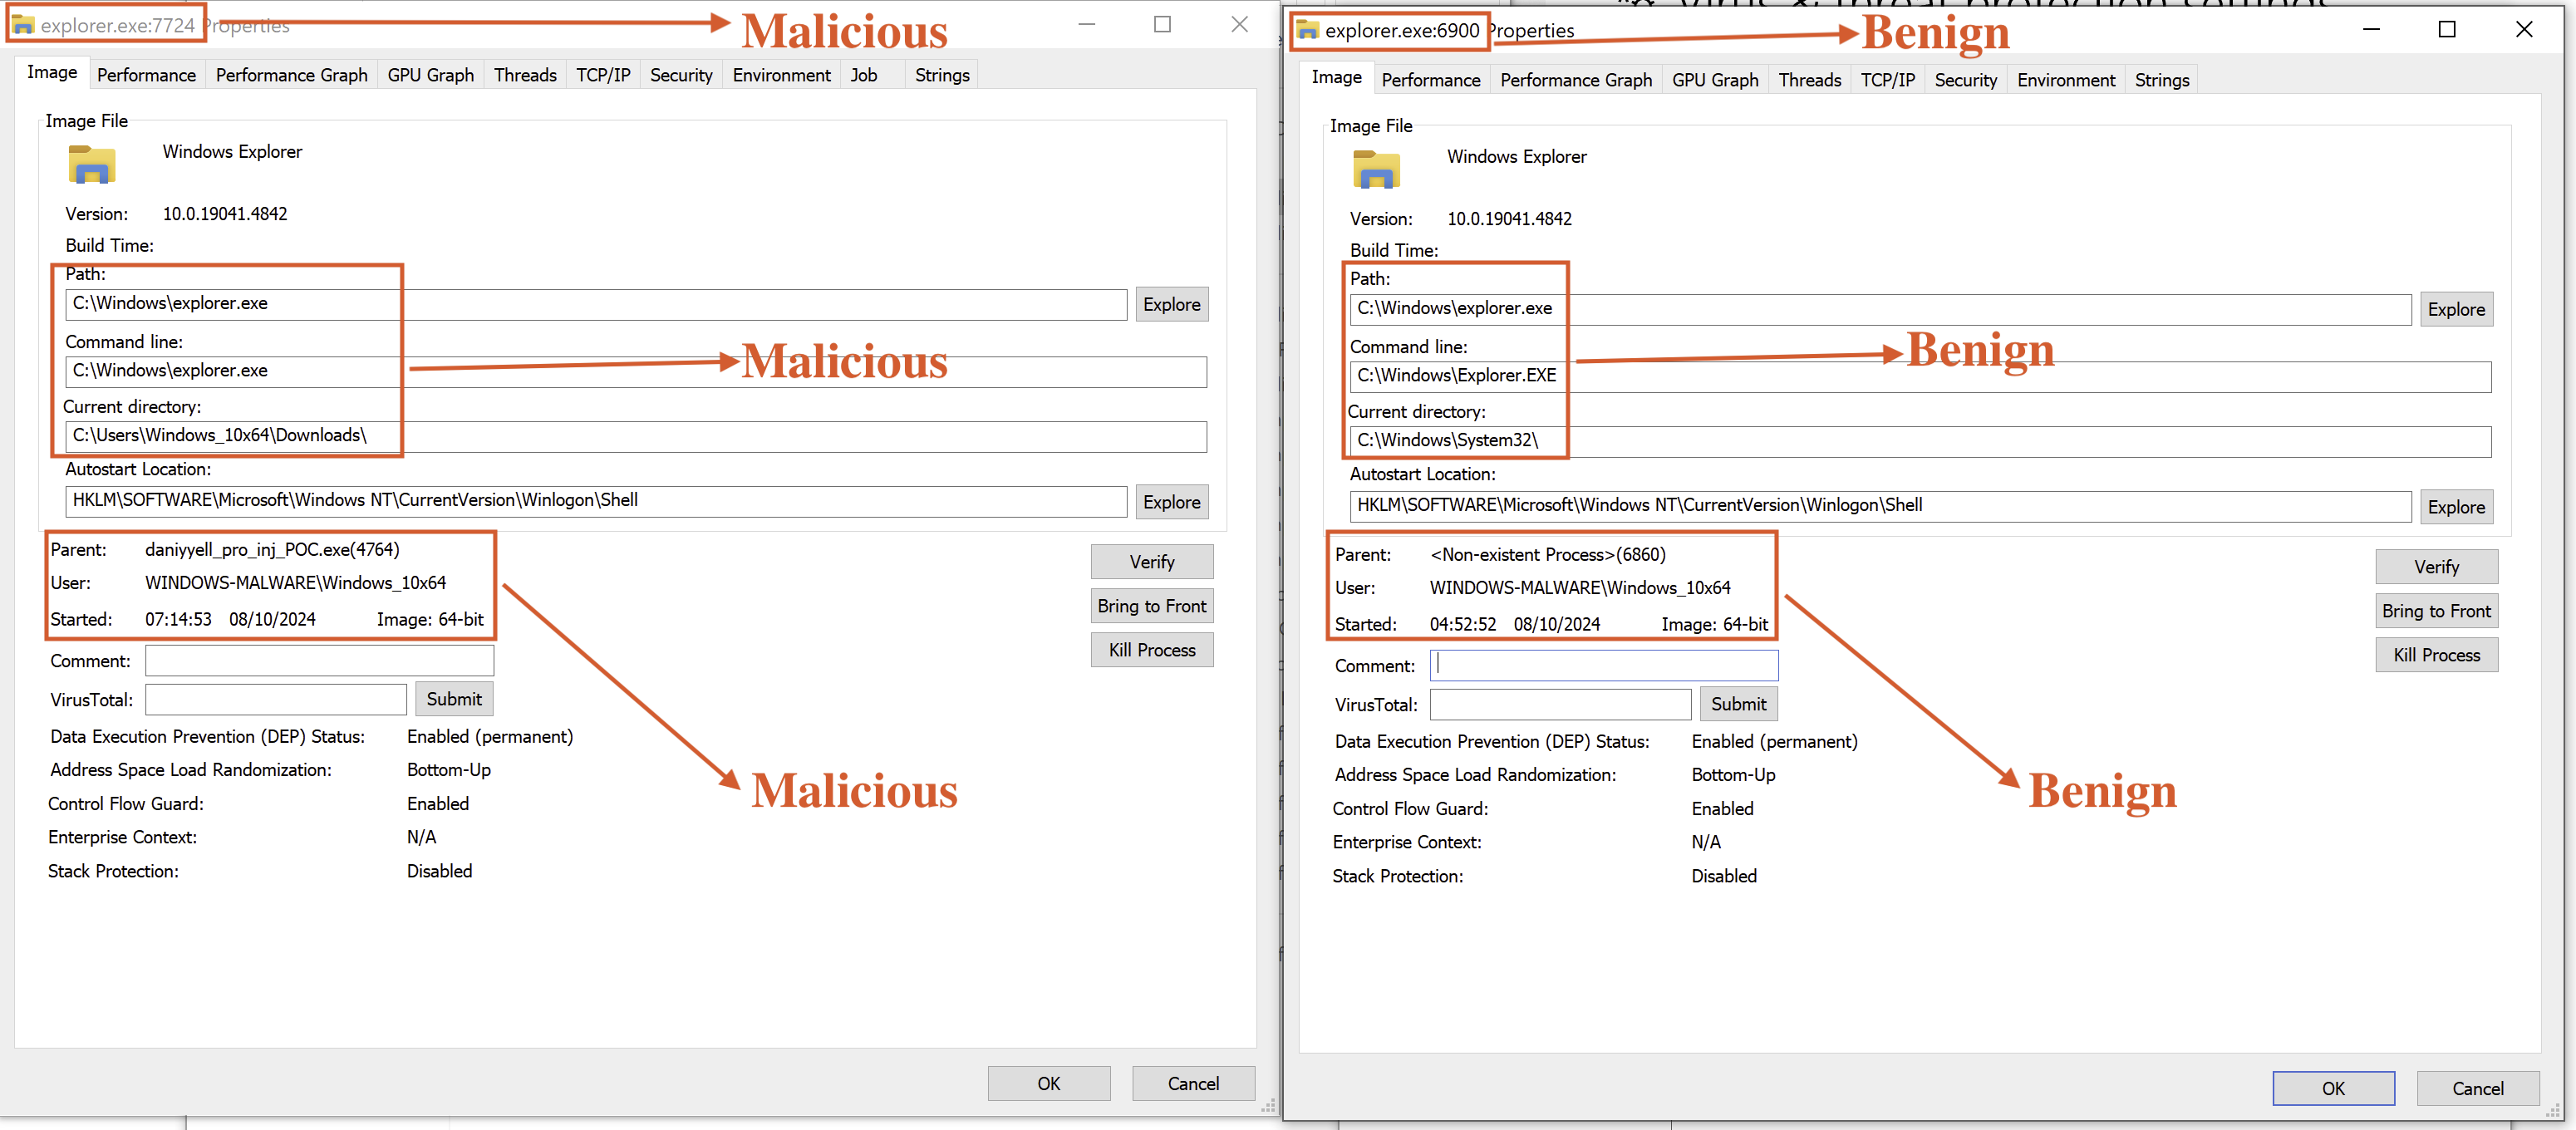
Fig 23: Comparison Analyses of explorer.exe
The malicious explorer.exe is running from a user-specific directory C: \Users\Windows_10x64 Downloads with a parent process daniyyell_pro_inj_POC.exe(4764), indicating malicious activity linked to the process hollowing. In contrast, the benign instance runs from the System32 directory without a parent process, highlighting its legitimate function as part of the Windows operating system.
Lastly, we examine the CPU and I/O comparison to identify differences between the benign and malicious processes, as shown in Fig 24.
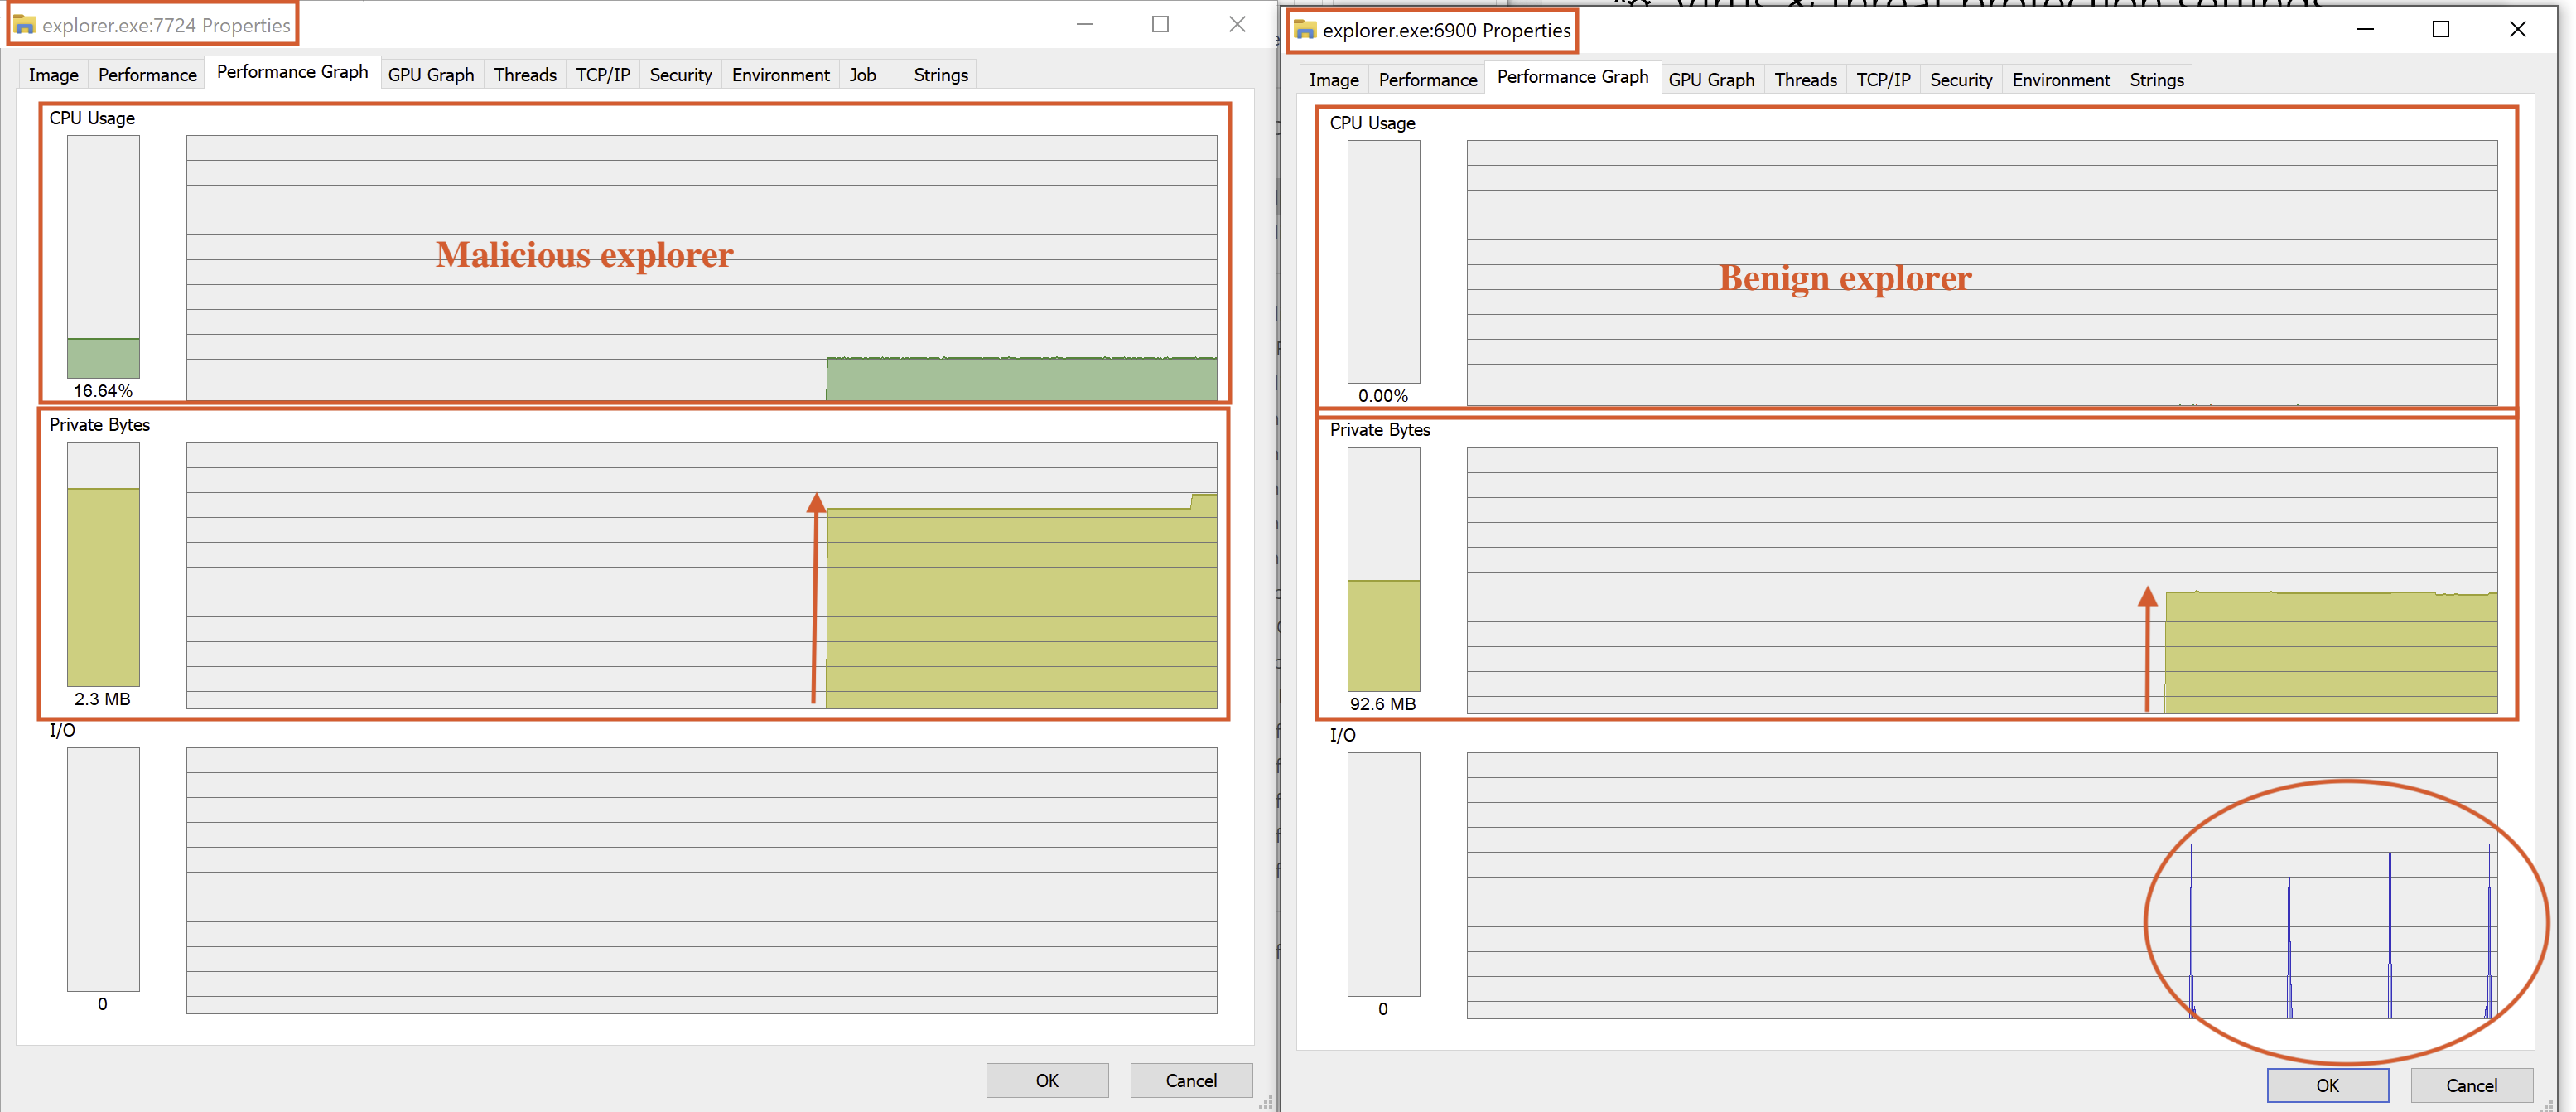
Fig 24: Analysing the CPU/IO Process
The results reveal that the malicious process does not utilise any I/O, while the benign explorer.exe does.
Additionally, we observe differences in memory usage. Although the malicious file operated for only a few minutes, we can see how its performance compares to that of legitimate explorer.exe.
Overall Conclusion
In this analysis, we successfully identified and validated the malicious behaviour of daniyyell_pro_inj_POC.exe through the use of Velociraptor. Our findings confirmed that this executable is involved in process hollowing, masquerading as legitimate system processes, specifically conhost.exe and explorer.exe. Despite their appearance as trustworthy Microsoft binaries, our investigation revealed that these processes were spawned by an untrusted executable, indicating a potential security threat. The analysis of CPU and I/O usage further reinforced our conclusions, highlighting the stark differences between benign and malicious processes.
Future Work
In future efforts, we aim to collect daniyyell_pro_inj_POC.exe for both static and dynamic analysis to uncover its command and control (C2) infrastructure and associated IP addresses. Gaining a deeper understanding of this malware will enhance our ability to develop effective YARA rules and update our Endpoint Detection and Response (EDR) rules to prevent similar threats in the future. Additionally, we can leverage more Velociraptor artefact parameters to enhance telemetry, focusing on registry modifications and other relevant behaviours. This comprehensive approach will help strengthen our security posture and improve our threat detection capabilities.
Disclaimer: The information provided in this analysis is for educational purposes only. The malware discussed in this report has been self-developed and has not been used for any abusive or malicious activities outside this controlled lab environment. The information shared is based on open-source tools, with the Linux server being SELKS. If you have any queries or projects you would like us to collaborate on, I am more accessible on LinkedIn or via email.
References
[1] Malwarebytes, “Process Doppelganging Meets Process Hollowing,” 2018. [Online]. Available: https://www.malwarebytes.com/blog/news/2018/08/process-doppelganging-meets-process-hollowing_osiris. [Accessed: 08-Oct-2024].
[2] Velociraptor, “Hunting with Velociraptor GUI,” 2024. [Online]. Available: https://docs.velociraptor.app/docs/gui/hunting/. [Accessed: 08-Oct-2024].
[3] MITRE ATT&CK, “T1055.012 - Process Injection: Process Hollowing,” 2024. [Online]. Available: https://attack.mitre.org/techniques/T1055/012/. [Accessed: 08-Oct-2024].
[4] IRED Team, “Process Hollowing and PE Image Relocations,” 2023. [Online]. Available: https://www.ired.team/offensive-security/code-injection-process-injection/process-hollowing-and-pe-image-relocations. [Accessed: 08-Oct-2024].
[5] TrustedSec, “The Nightmare of Process Hollows,” 2022. [Online]. Available: https://trustedsec.com/blog/the-nightmare-of-proc-hollows-exe. [Accessed: 08-Oct-2024].
[6] Malwarebytes Forums, “Malware Exploit Agent Process Hollowing Protection Blocked Word,” 2020. [Online]. Available: https://forums.malwarebytes.com/topic/285775-malwareexploitagent-process-hollowing-protectionblocked-word/. [Accessed: 08-Oct-2024].
[7] Deep Instinct, “Malware Evasion Techniques Part 1: Process Injection and Manipulation,” 2024. [Online]. Available: https://www.deepinstinct.com/blog/malware-evasion-techniques-part-1-process-injection-and-manipulation. [Accessed: 08-Oct-2024].


)
